Buy Zone
Shows the actionable buying range based on recent support, price structure and technical context.
Generate technical charts for every stock in your watchlist—or any custom stock list—in less than one minute. During live market hours, the tool can be used repeatedly to create updated technical charts with fresh price data.
What it does
The tool converts live or latest market data into chart-based trading context. It helps you quickly scan stocks and identify buy zones, stop-loss levels, target prices, trend direction, signal quality, volume behaviour and RSI momentum.
Shows the actionable buying range based on recent support, price structure and technical context.
Highlights the risk level below the setup so traders can understand downside risk before acting.
Displays the first target or sell zone based on resistance, risk-reward and chart structure.
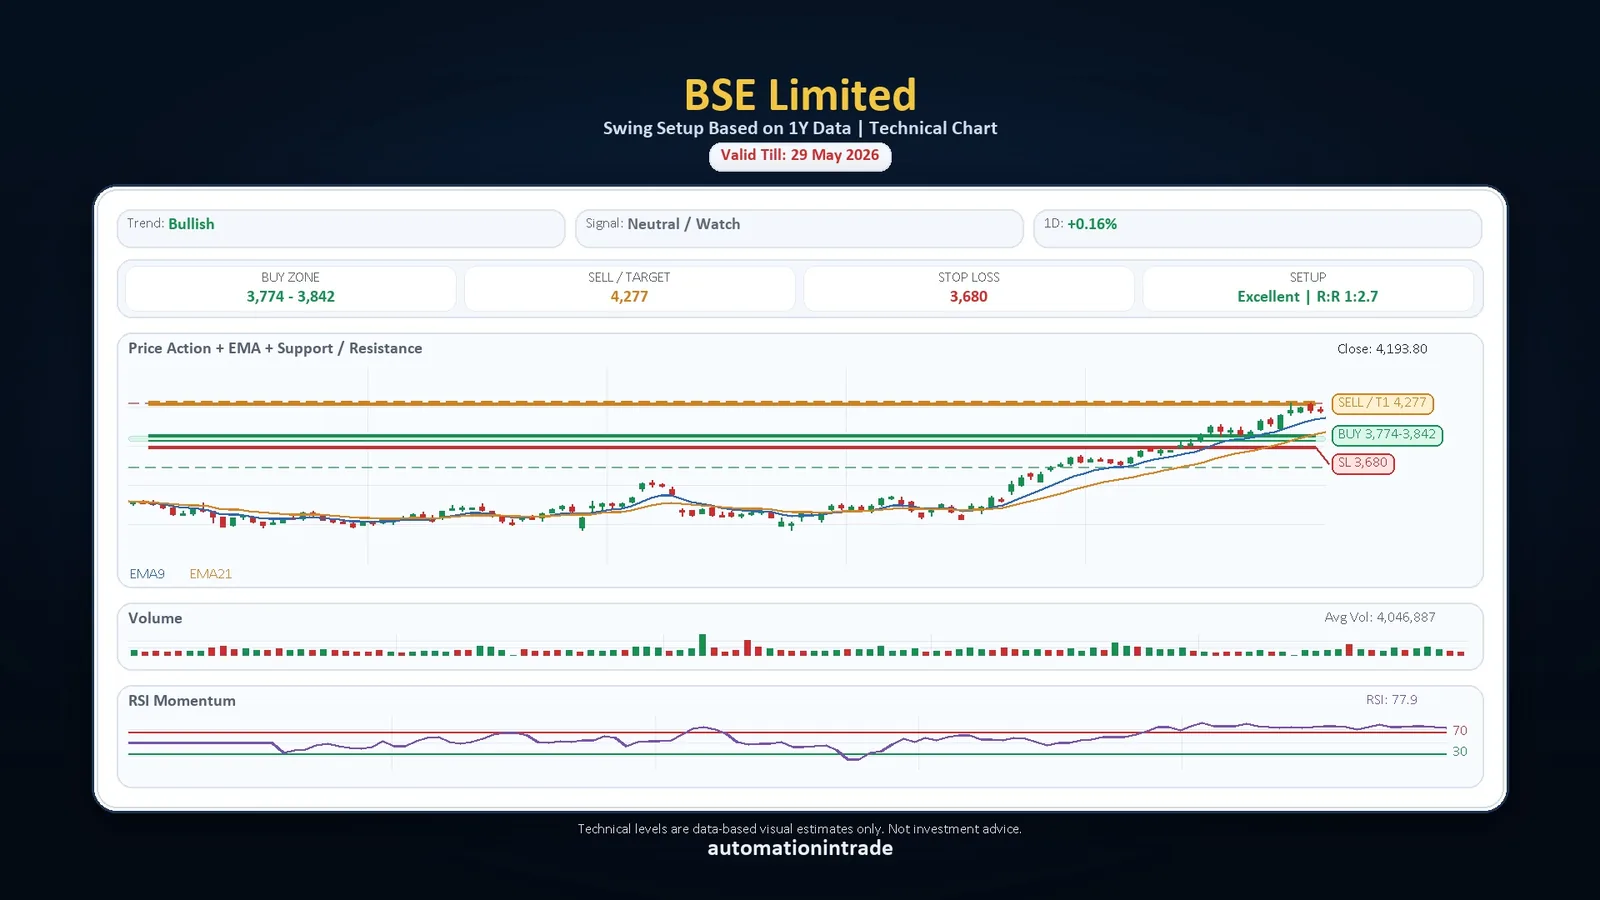
Sample output preview
These sample charts show how the tool packages price action, EMA, support/resistance, volume, RSI, buy zone, stop-loss and target levels into a single visual output.
Buy zone, target, stop-loss, trend and RSI shown in one chart.
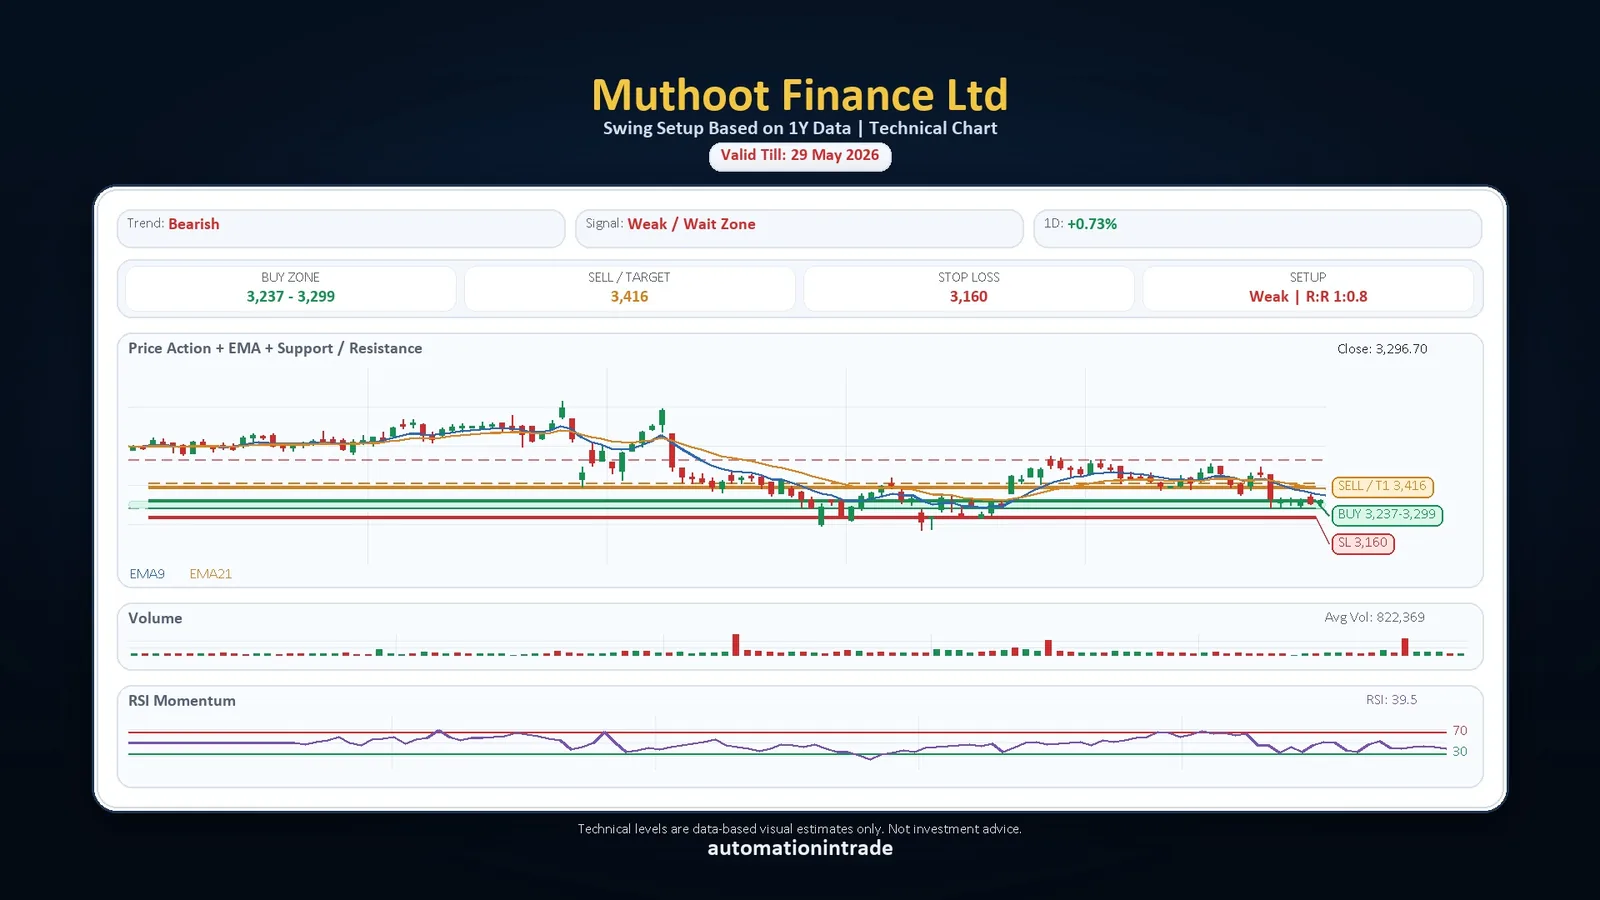
Weak / wait-zone setup with risk and resistance context.
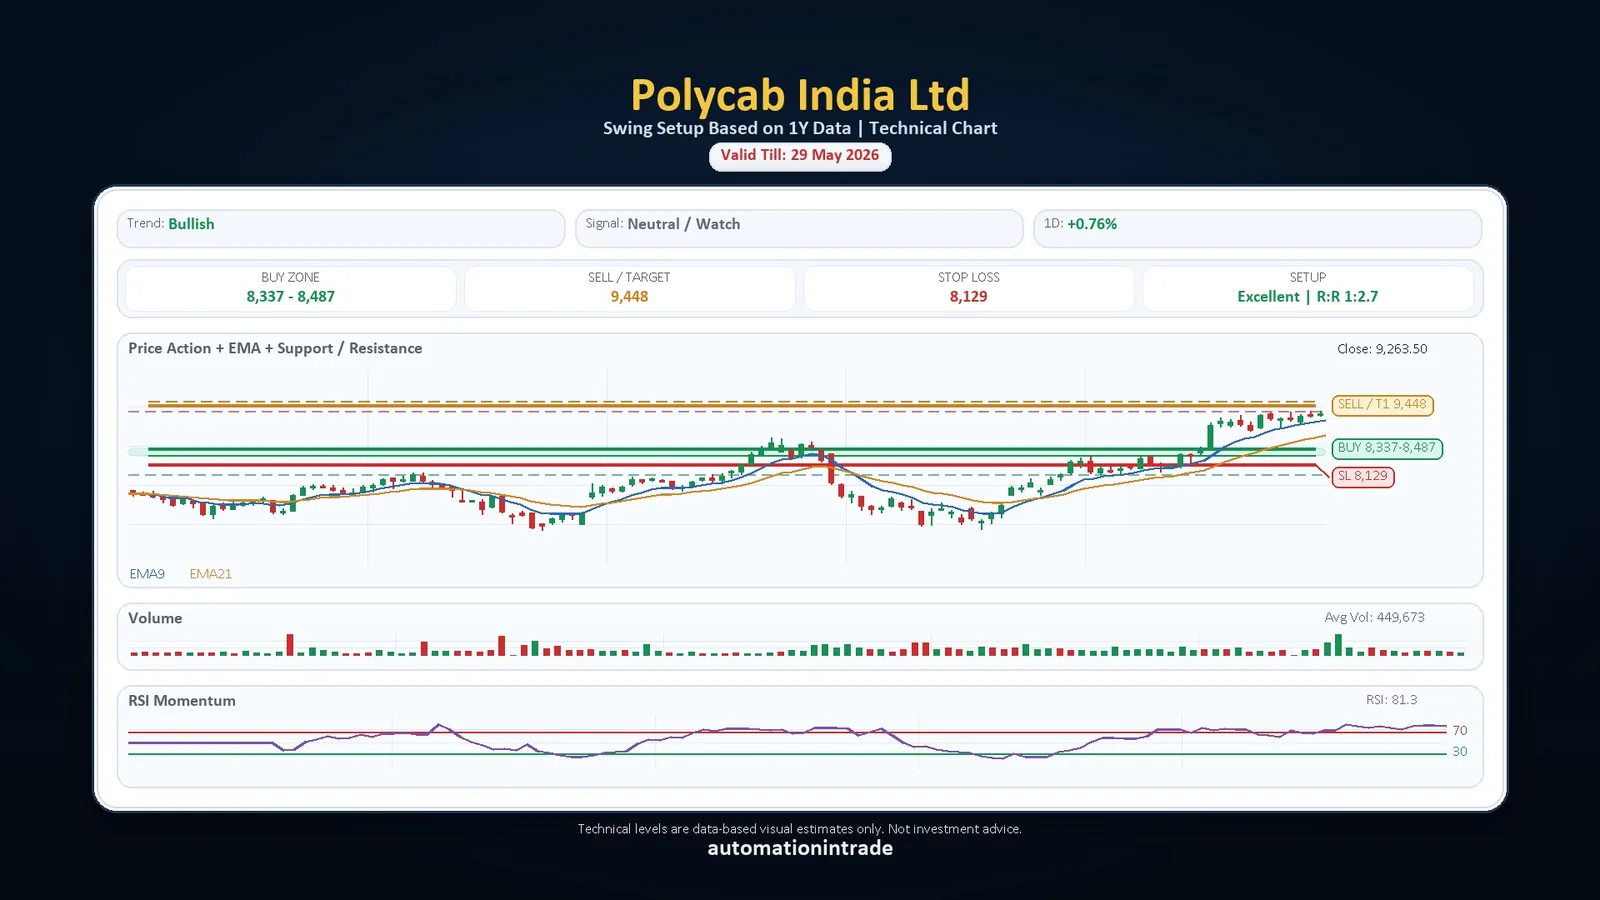
Bullish setup view with buy zone, sell target and stop-loss.
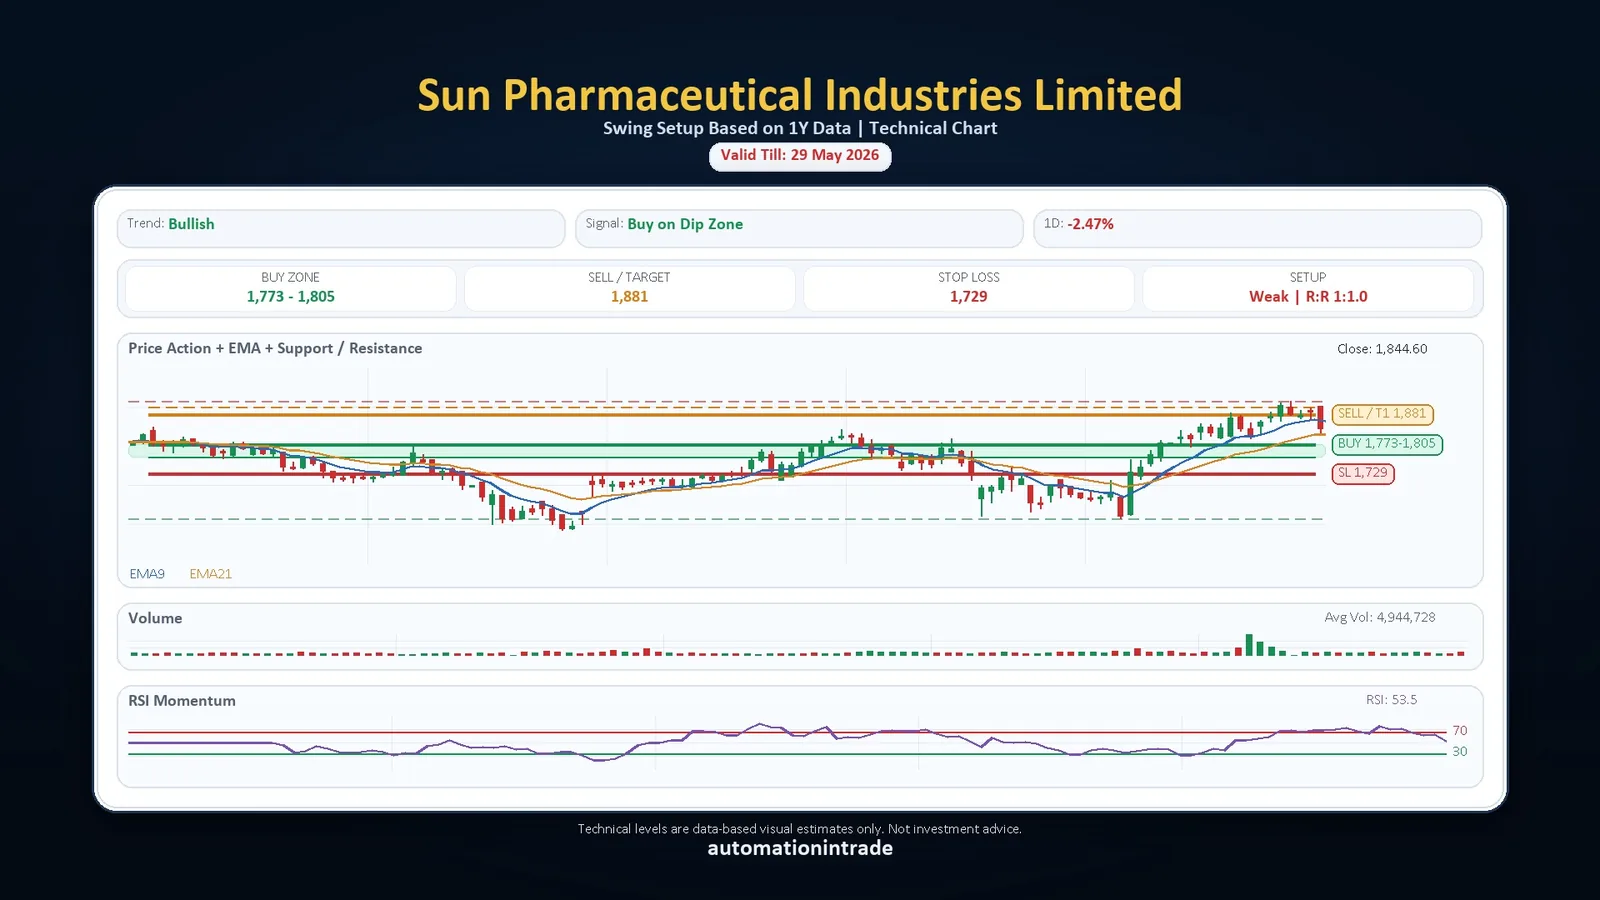
Buy-on-dip style technical view with current chart levels.
Why it matters
Instead of opening every stock manually and marking levels one by one, the tool can process a watchlist and generate ready-to-read charts quickly. This makes it useful for traders who want structured technical views before deciding which stocks deserve attention.
Automation In Trade
Use the form to request demo access, purchase details, or a custom workflow for your own watchlist and technical chart automation.