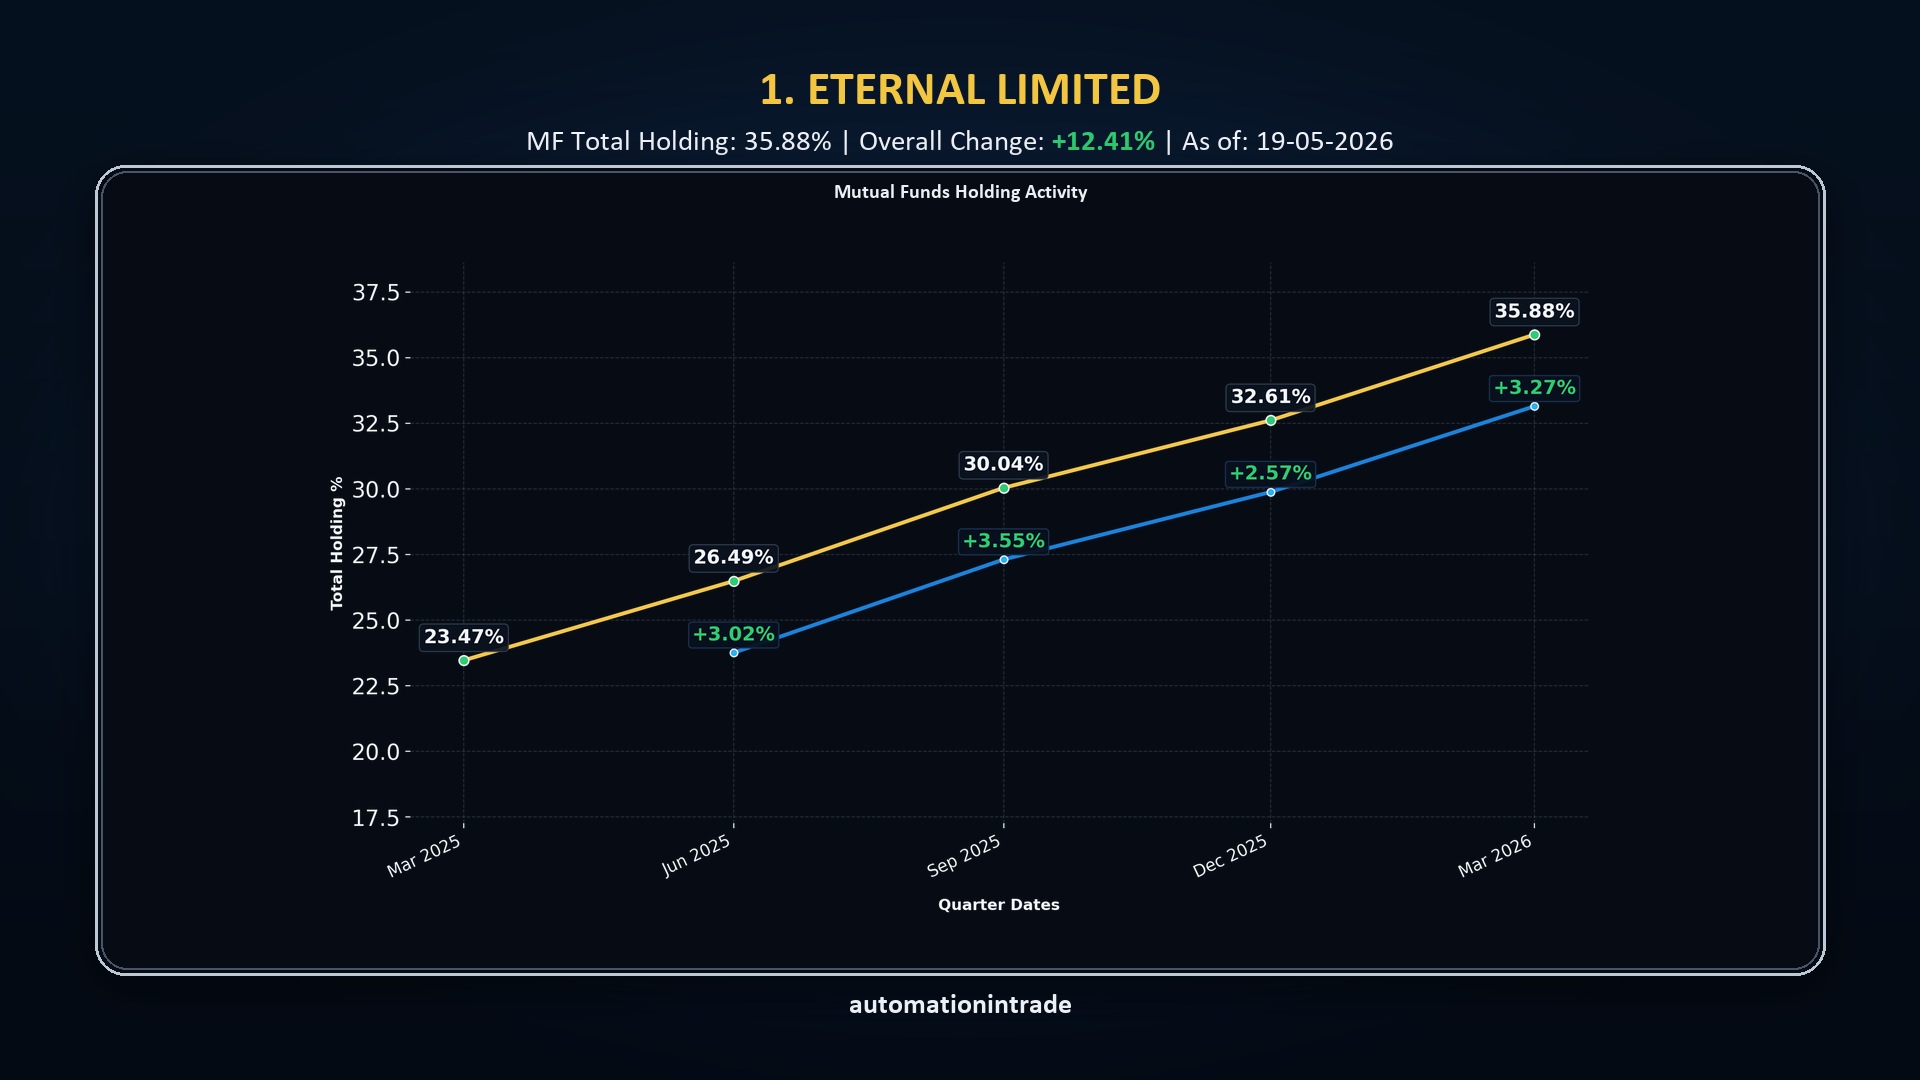
Eternal Limited
Mutual fund holding rose steadily across the visible quarters, with the overall change reaching +12.41%. The chart helps identify consistent institutional accumulation in a simple visual format.
Institutional Holding Activity Tracker
Scan over 4,000 NSE-listed stocks with a single click and identify quarter-over-quarter changes in holdings by Mutual Funds, FIIs, Promoters, and Retail Investors.
Click play to watch the demo here. Users can subscribe, open YouTube, or expand the demo to full screen.
Sample output preview
These sample charts show how the tool separates accumulation and reduction patterns so users can quickly understand where mutual fund exposure is rising or falling.
Sample output showing the strongest quarter-over-quarter increases in mutual fund holdings.
Mutual fund holding rose steadily across the visible quarters, with the overall change reaching +12.41%. The chart helps identify consistent institutional accumulation in a simple visual format.
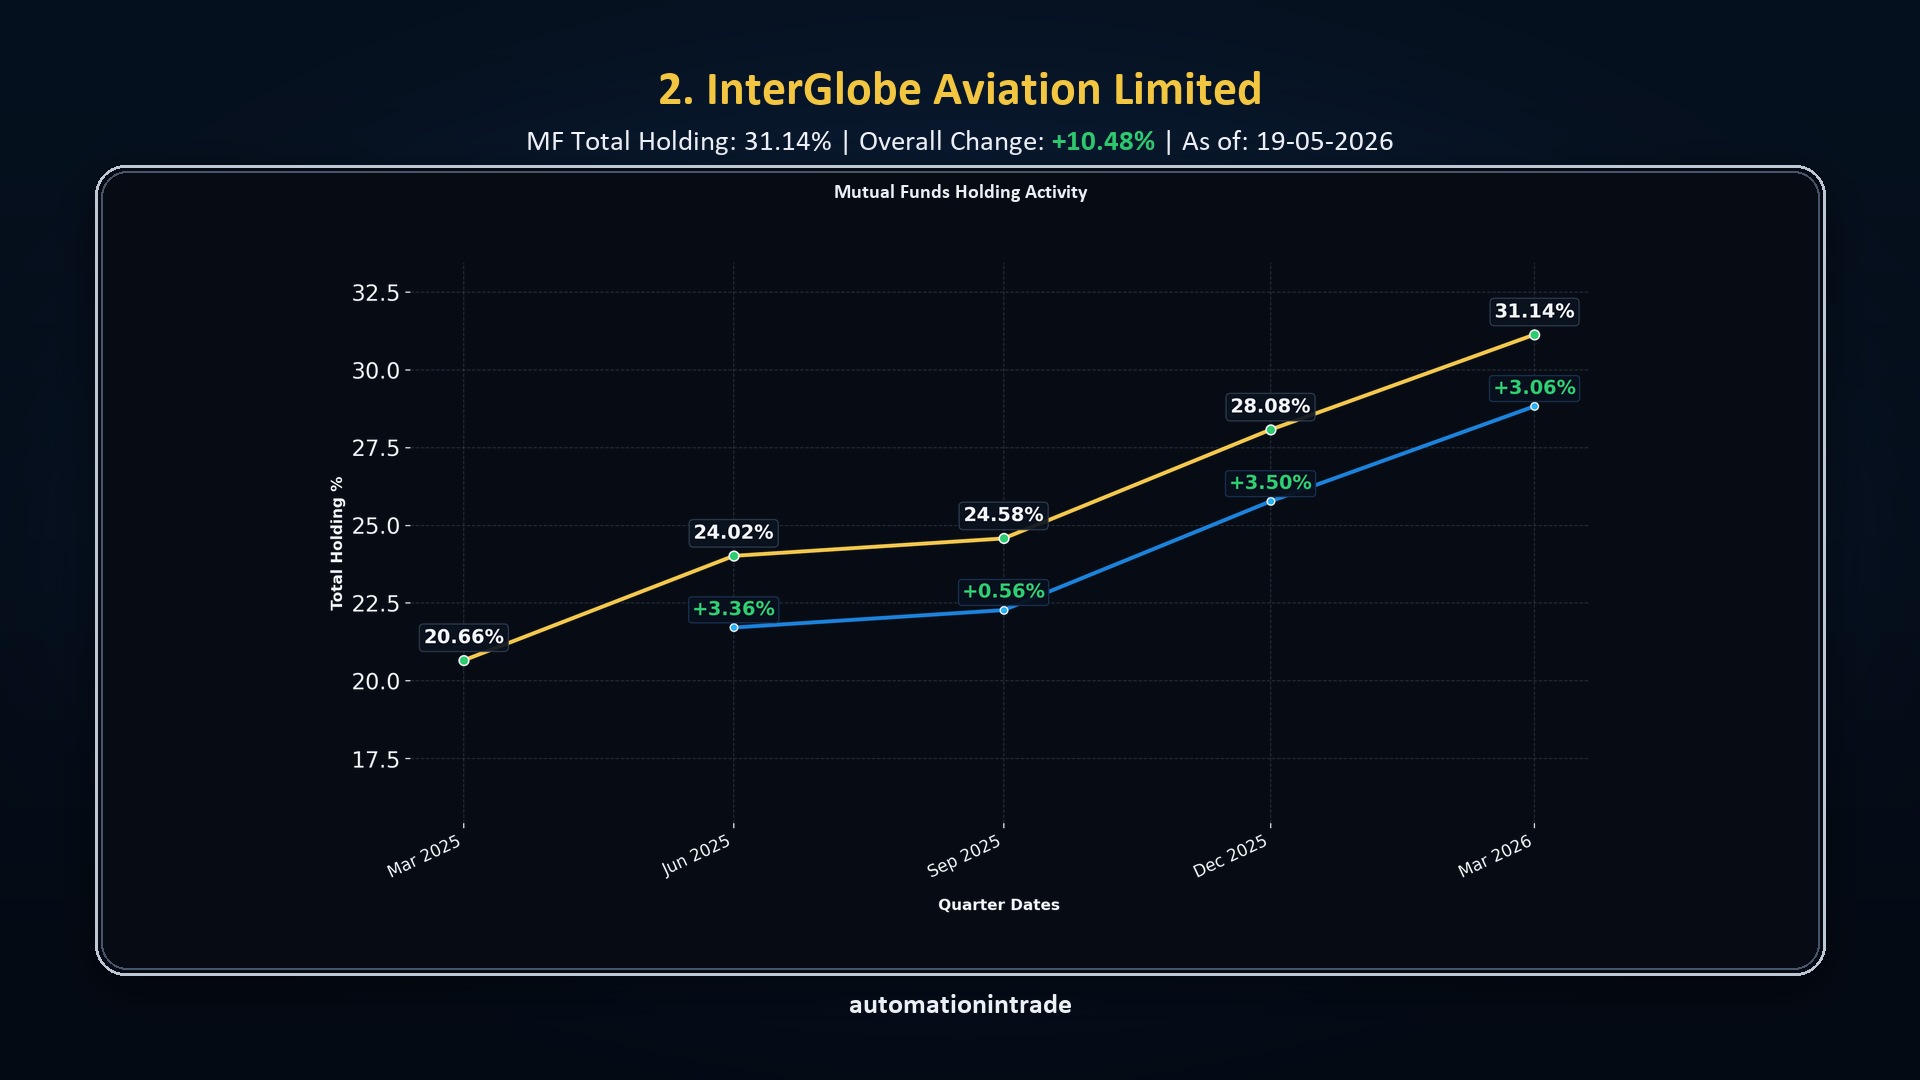
The sample output highlights a strong QoQ rise in mutual fund exposure, ending with a +10.48% overall change. This makes accumulation trends easier to spot without reading raw holding tables.
Sample output showing stocks where mutual fund exposure reduced sharply quarter-over-quarter.
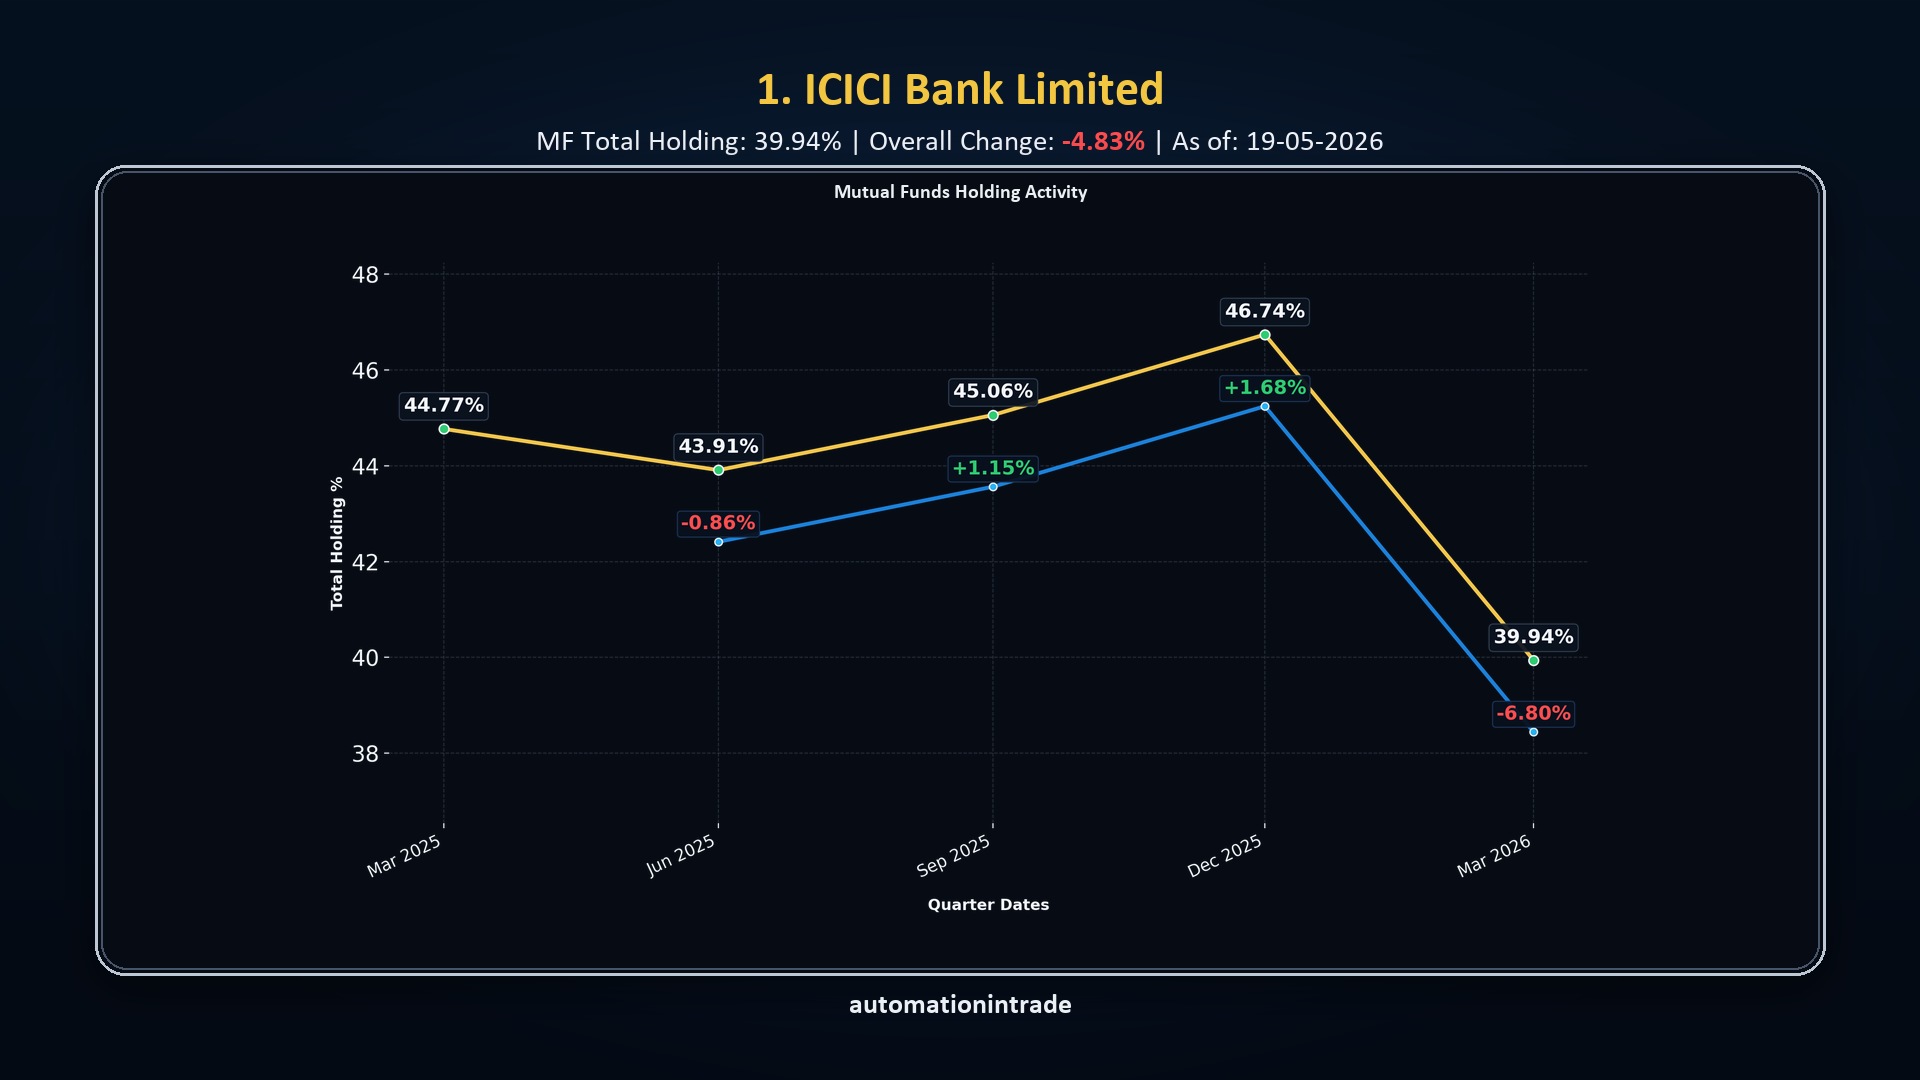
The chart shows a meaningful decline in the latest quarter, taking the overall change to -4.83%. It helps users quickly identify where mutual funds have reduced exposure.
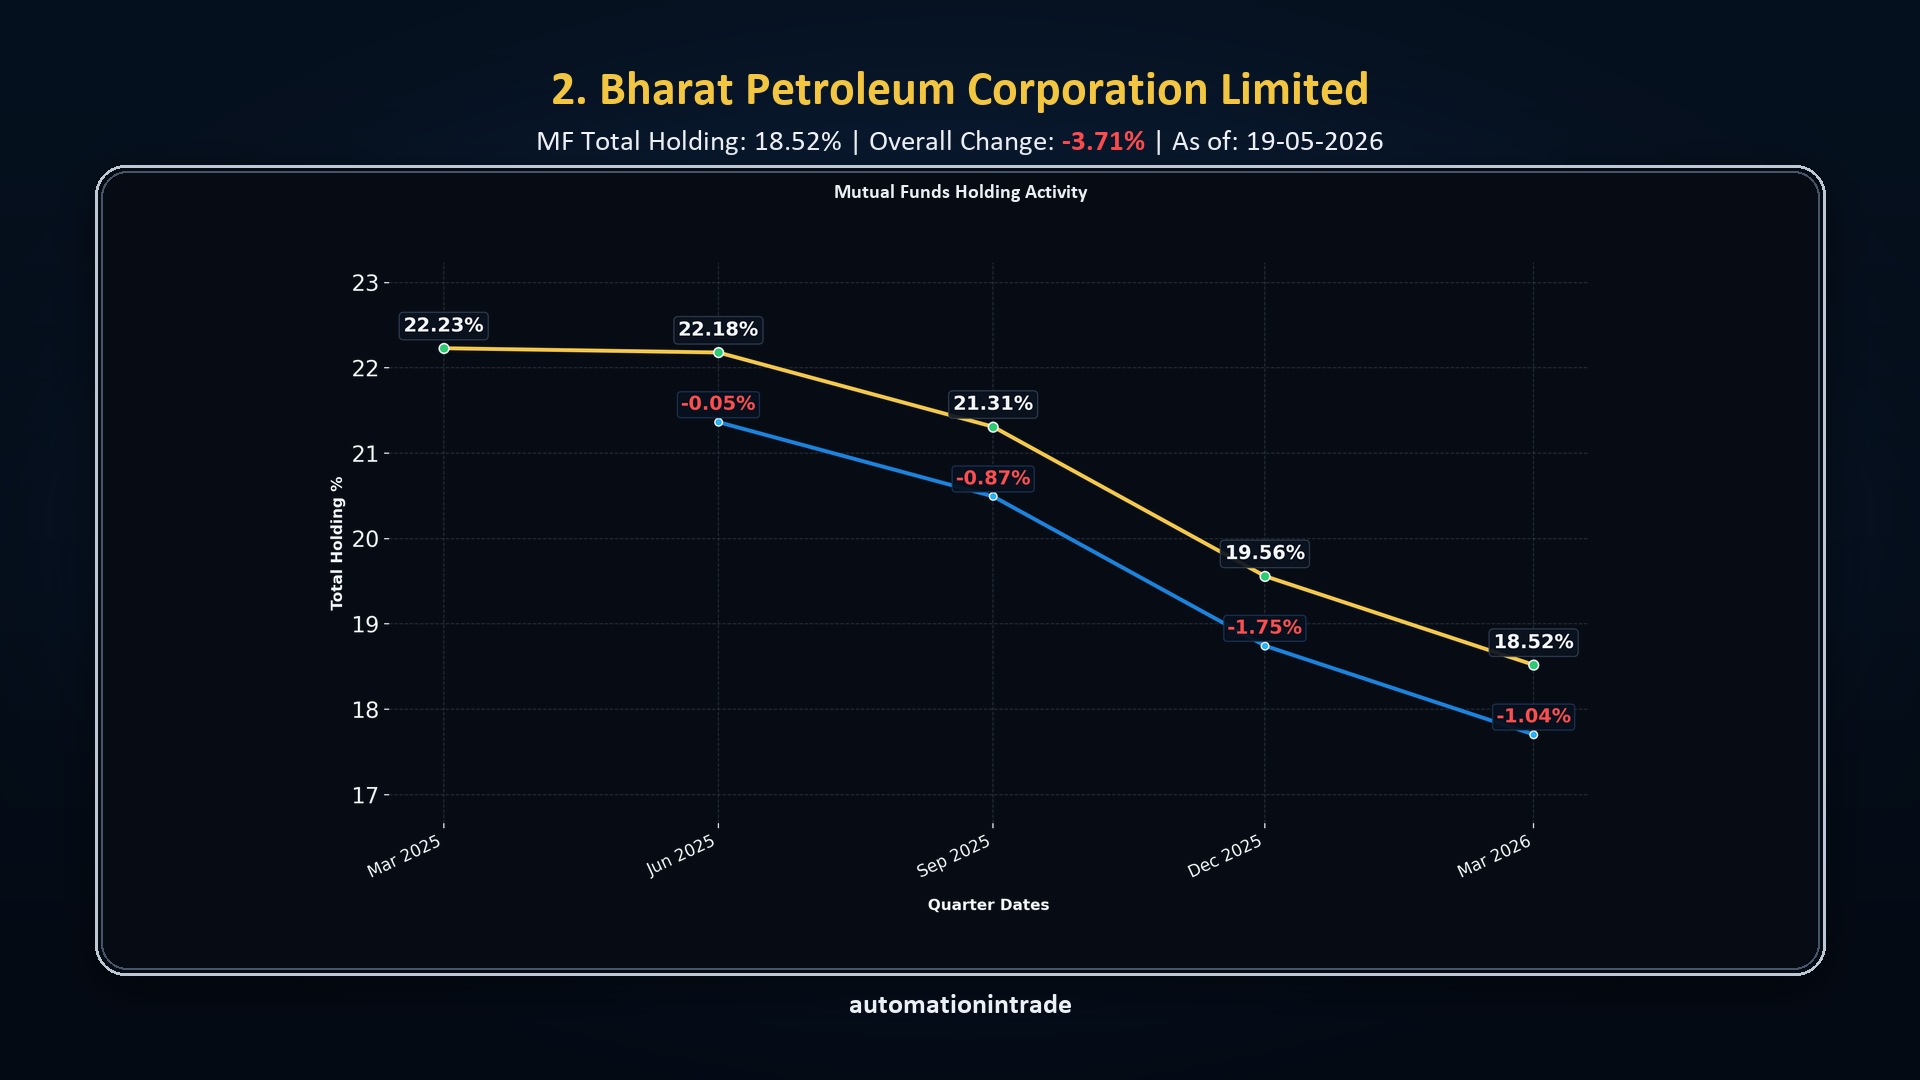
This sample shows a gradual fall in mutual fund holding across quarters, with the overall change at -3.71%. The visual output makes offloading patterns easier to compare stock by stock.
What it does
The tool converts raw shareholding changes into ranked lists and visual charts so you can quickly understand where institutional capital is moving.
Find stocks where mutual funds have increased or reduced holdings quarter-over-quarter.
Track foreign institutional activity and identify stocks seeing stronger or weaker FII exposure.
Compare promoter and retail investor participation to understand broader ownership changes.
Output
Within a few minutes, the tracker can generate lists of stocks where institutions have significantly increased positions or substantially reduced exposure.
Workflow
Run a single-click scan across NSE-listed stocks and their latest available holding data.
Sort stocks by the biggest increase or decrease in MF, FII, promoter, and retail holdings.
Generate simplified charts that make stock-wise holding trends easier to read and share.
Automation In Trade
Connect with Automation In Trade for market visuals, institutional activity tracking, and data-based stock market automation tools.