PCR + Writer Bias
Highlights whether call or put activity is dominating and whether writers are building bullish, bearish or neutral pressure.
Option Sentiment retrieves live, minute-by-minute option-chain data for your watchlist or custom stock list. It helps you compare hundreds—even thousands—of stocks during live market hours and quickly understand option-chain mood using Excel summaries and clean visual cards.
What it does
The tool reads live option-chain data and converts key fields such as PCR, writer bias, trend, max pain, IV skew, volume/OI, ATM delta and combined sentiment into a simple scorecard. You can inspect the Excel sheet for deeper analysis or use the visuals to decide within seconds.
Highlights whether call or put activity is dominating and whether writers are building bullish, bearish or neutral pressure.
Shows max pain placement, projected range, support, resistance and important CE/PE wall zones.
Tracks skew, volume/OI and ATM Greeks to identify pressure, caution zones and possible sentiment shifts.
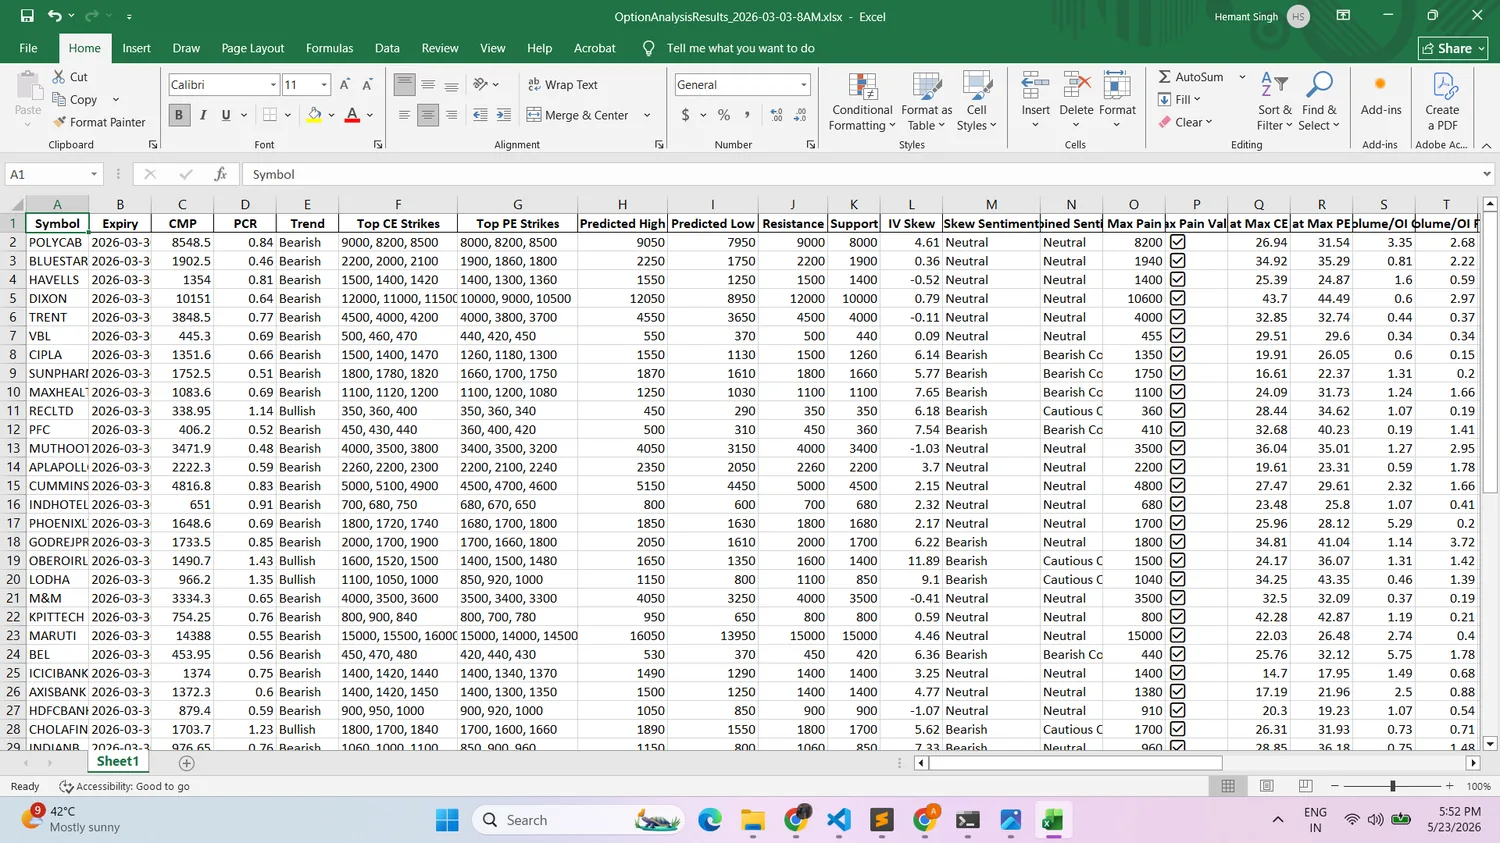
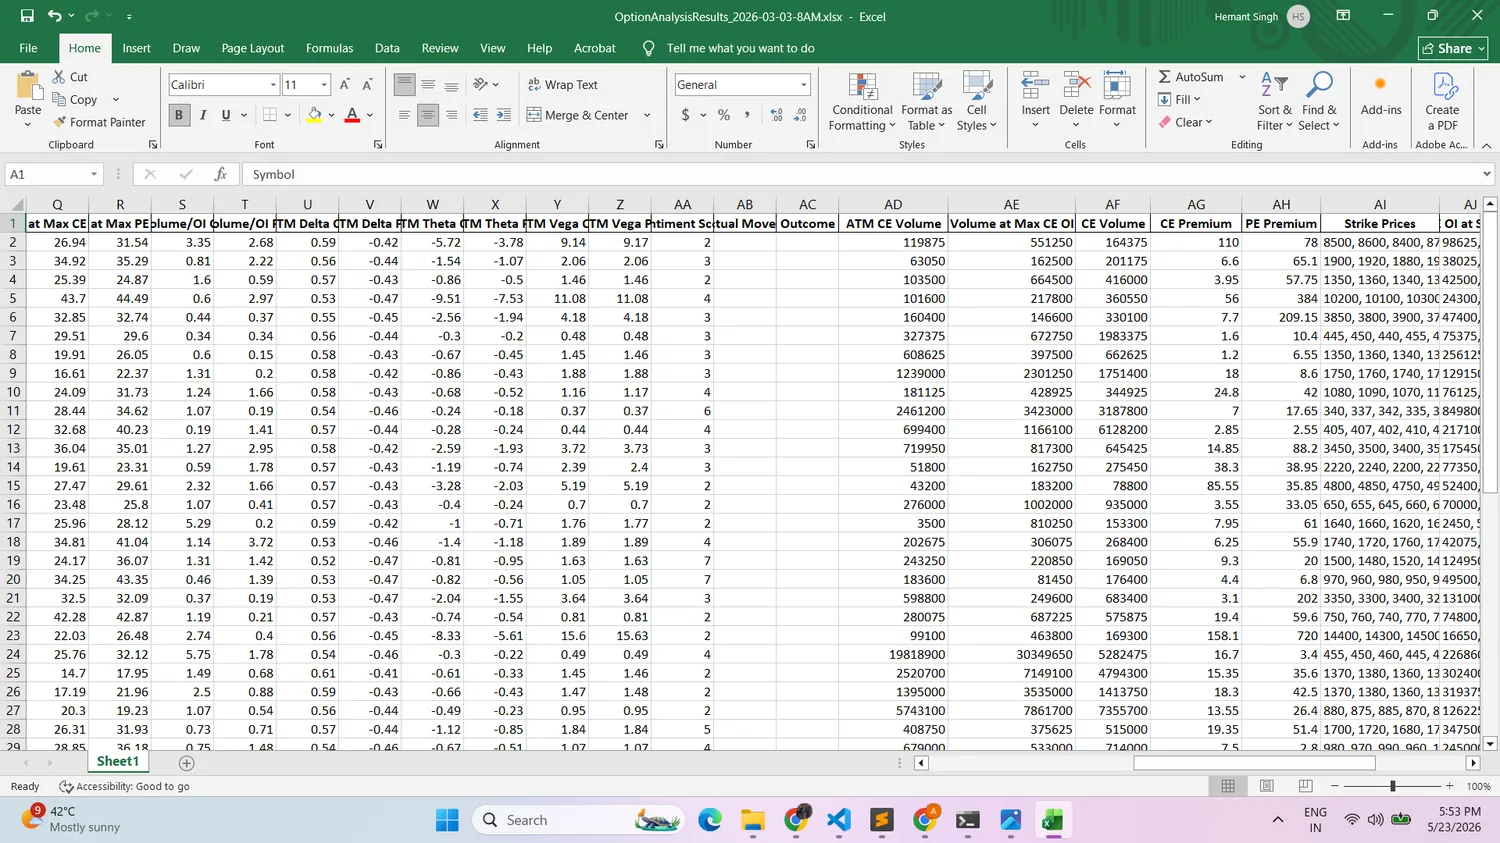
Excel intelligence layer
The Excel output acts like a live market dashboard. It lets you compare CMP, PCR, trend, CE/PE strikes, predicted high/low, support, resistance, IV skew, max pain, Greeks, volume, premiums and strike-level activity across your full watchlist.
If you do not want to read the sheet during market hours, the visual cards compress the same idea into a quick final verdict, confidence score and action-plan view.
Why use it during live market hours?
Compare option-chain mood across your full watchlist instead of opening each stock manually.
Final verdict, score and confidence help you quickly filter bullish, bearish, neutral and mixed setups.
Top CE/PE strikes, support, resistance and max pain make key zones easier to understand.
Use Excel for detailed comparison or visual cards for quick decisions and content-ready outputs.
Run it continuously during market hours to capture sentiment changes as option data updates.
Creates branded cards that can support daily analysis, market updates and social-media publishing.
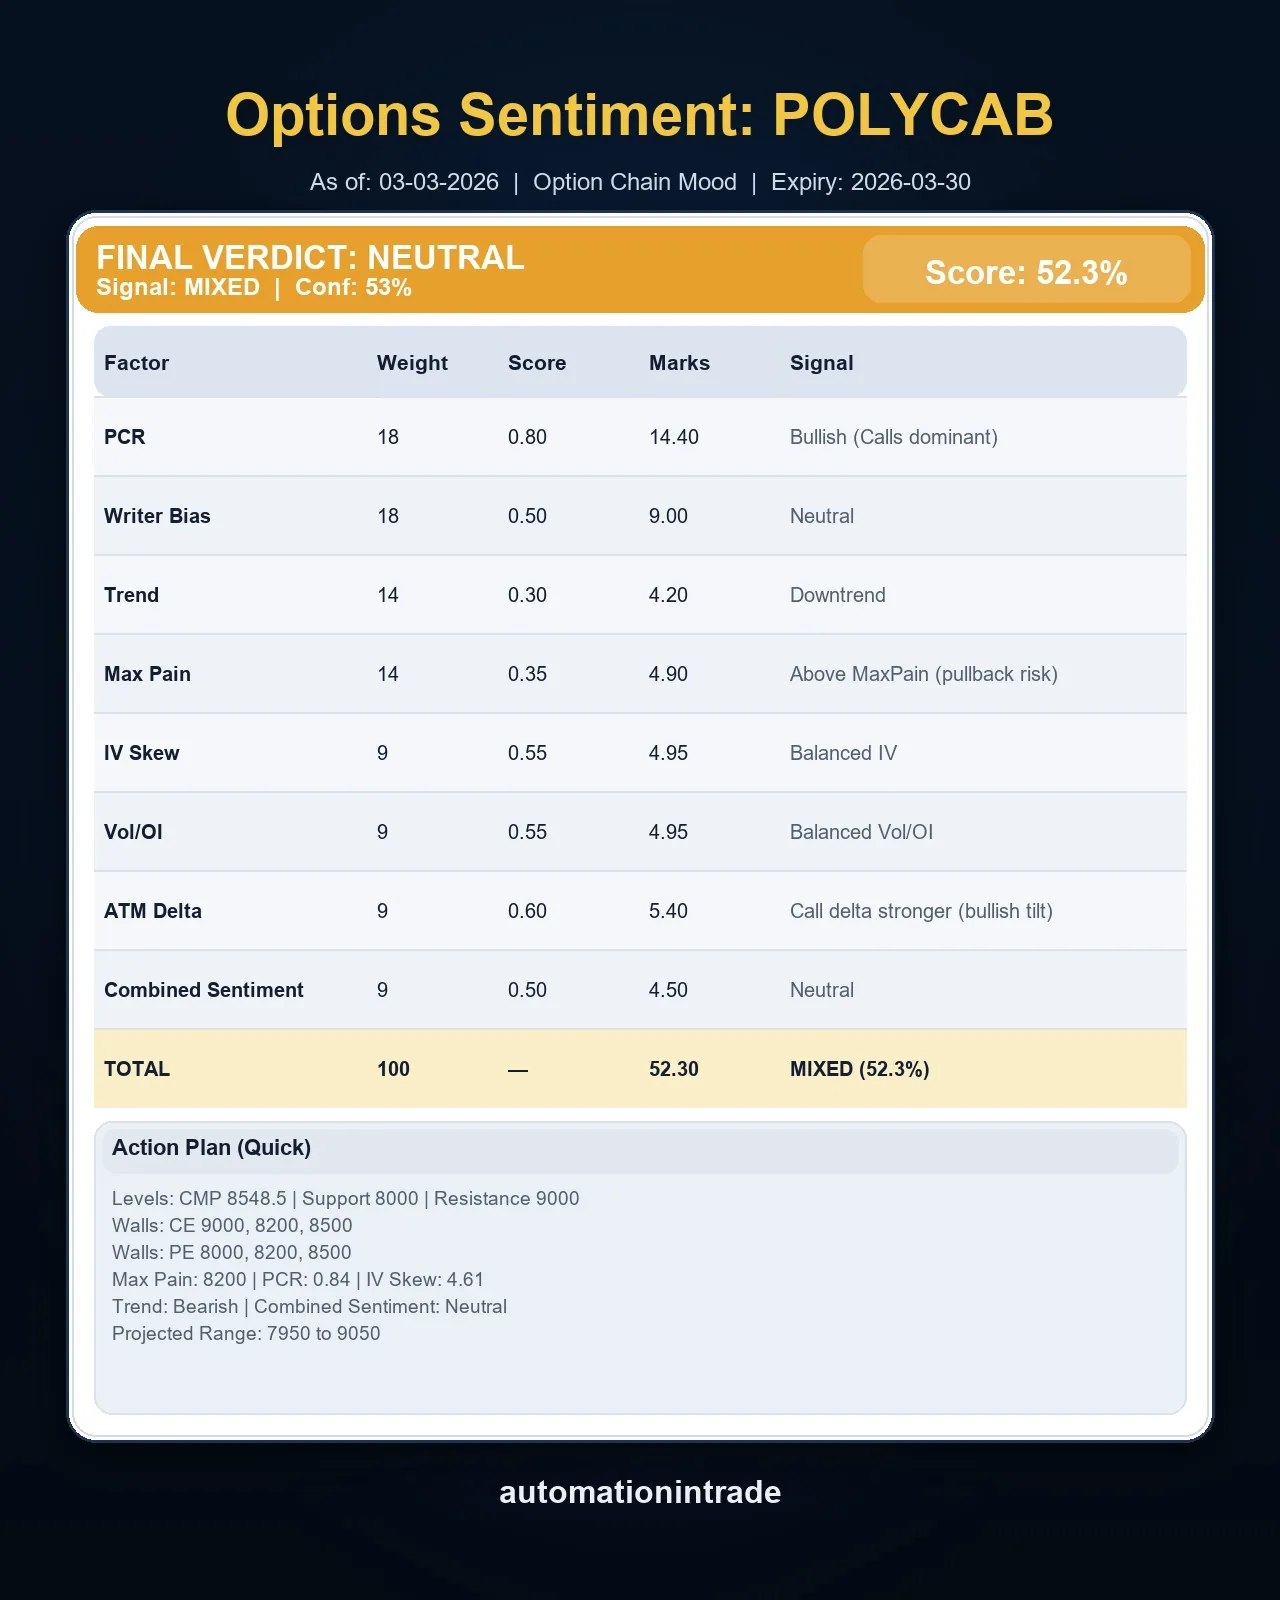
Sample output preview
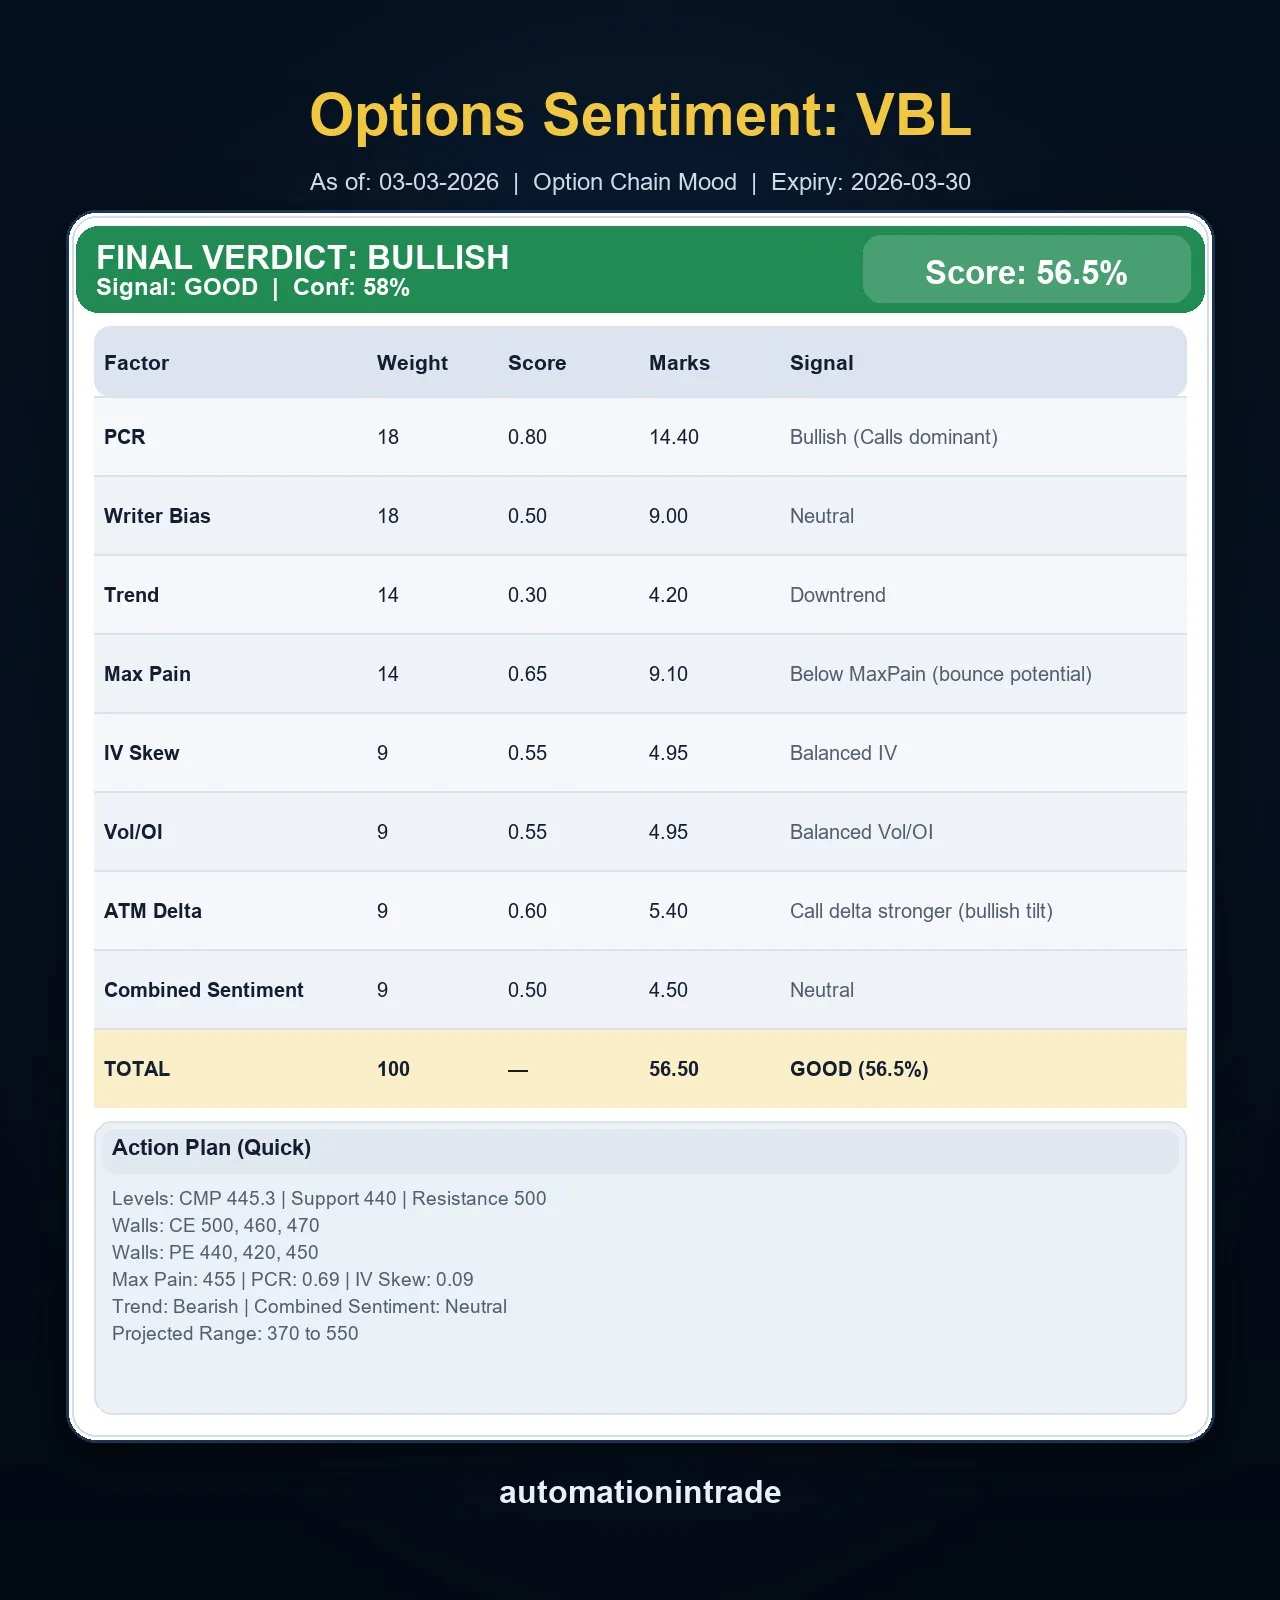
Each card compresses option-chain mood into final verdict, score, factor-level marks, signal interpretation and a quick action-plan view.
Neutral/mixed verdict with score, support, resistance, PCR and projected range.
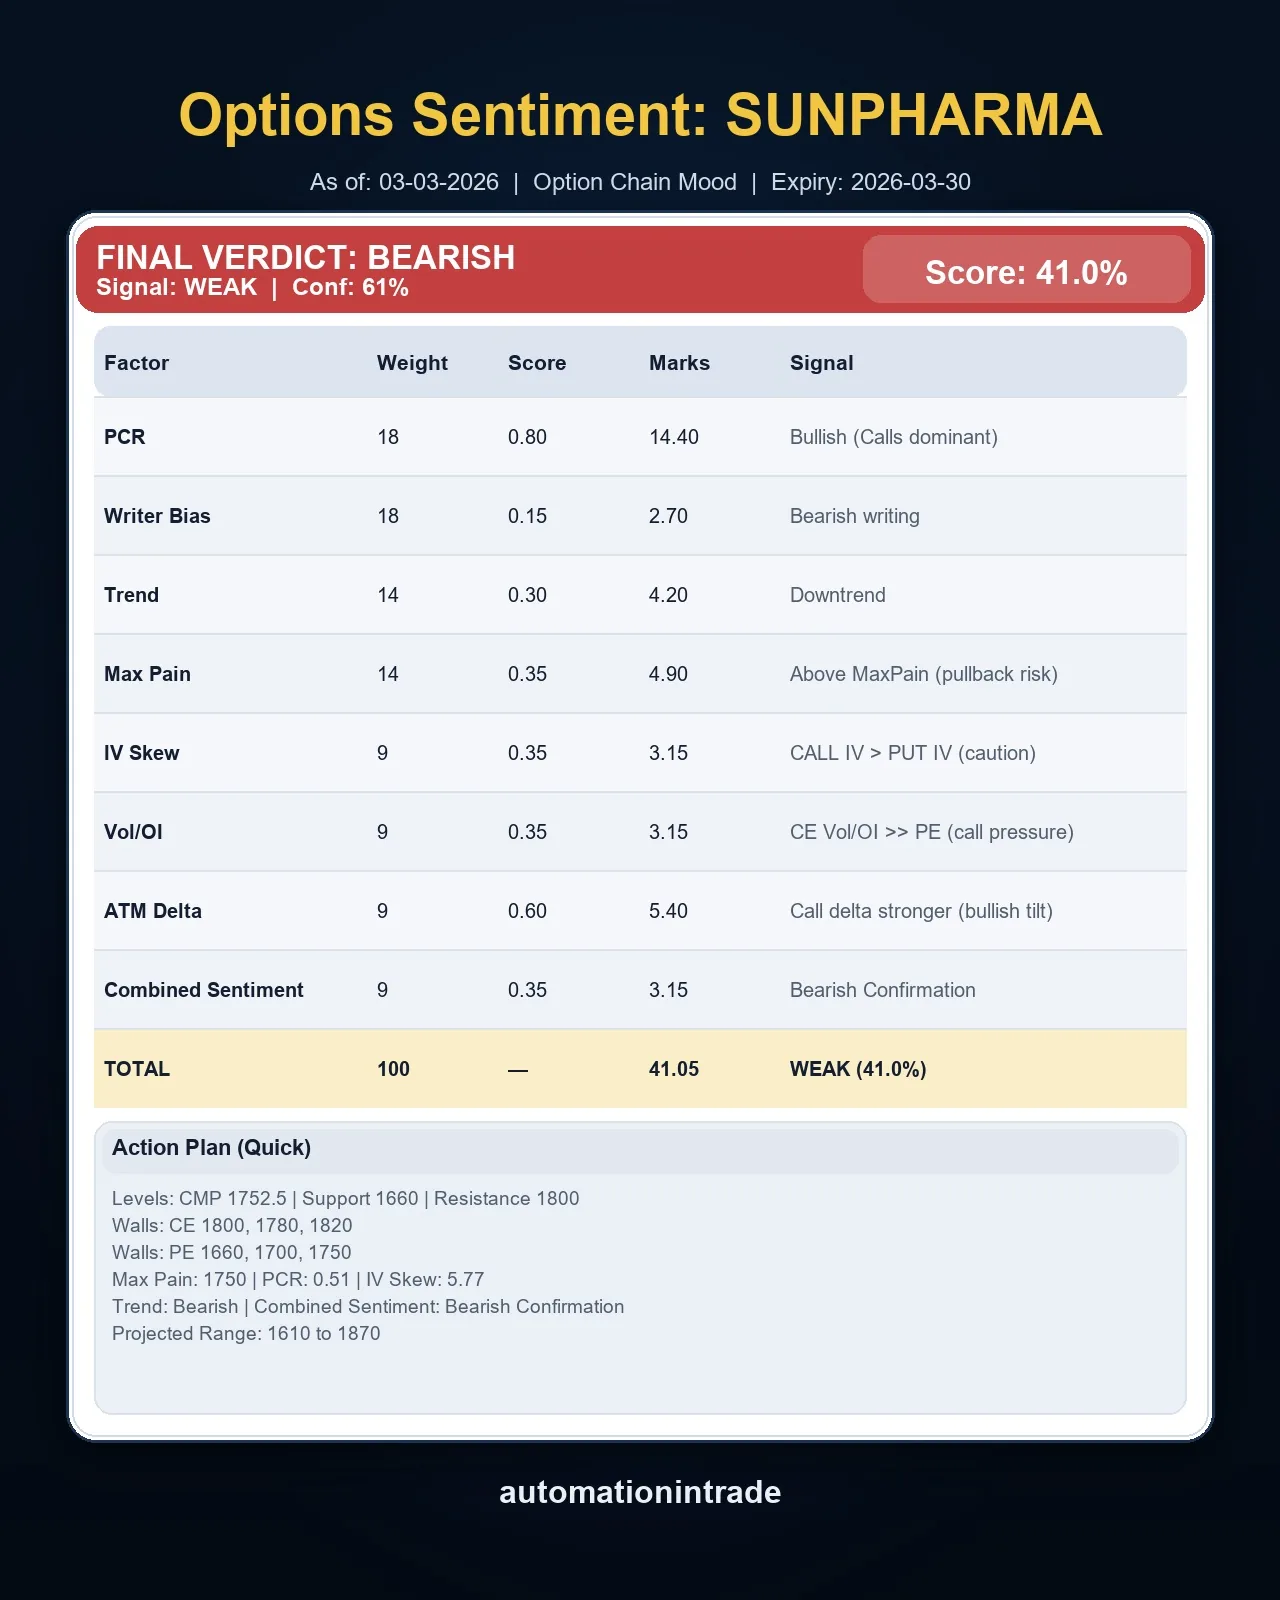
Bearish scorecard view showing writer bias, IV skew and caution signals.
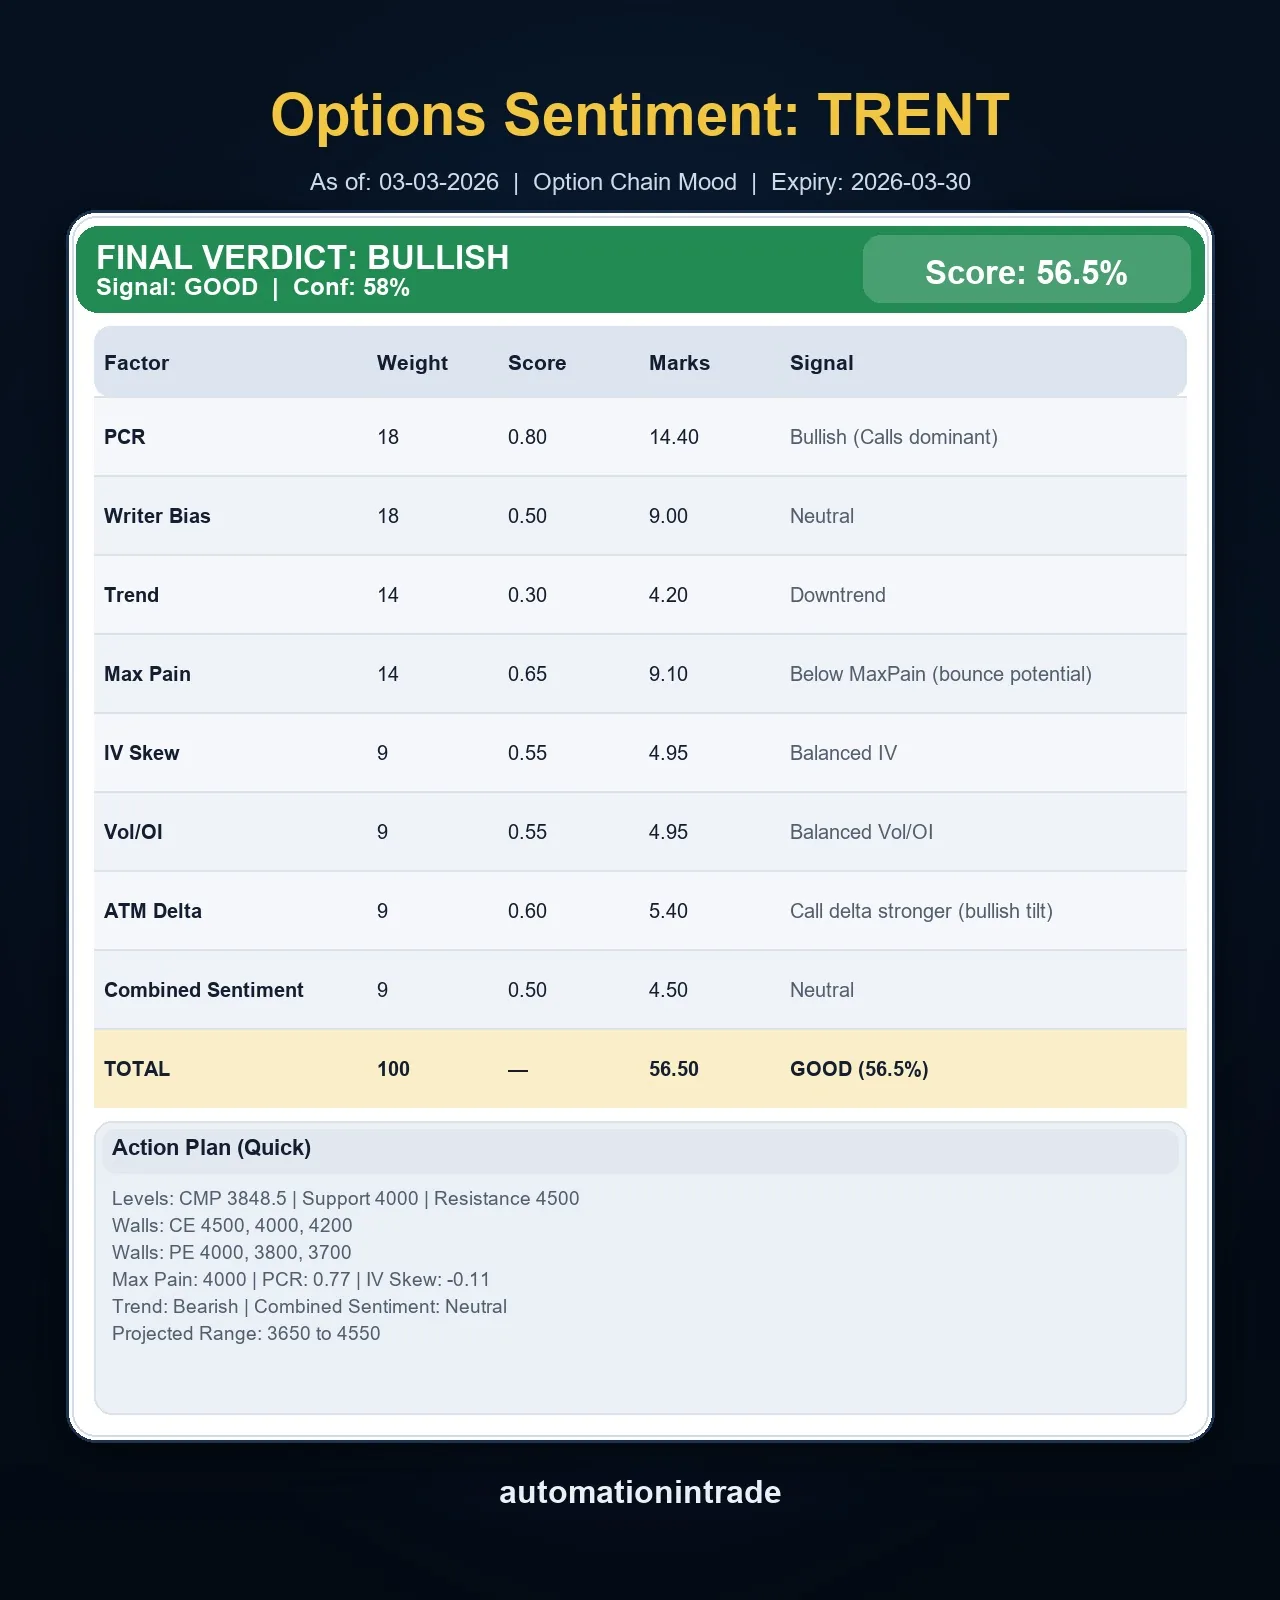
Bullish verdict layer with max pain, PCR and projected range context.
Live-market style scorecard for quick visual interpretation.
Automation In Trade
Request access for demo, purchase details, or custom setup using your own stock list and output format.