Live Result ScoresRisk MapsTrading Bias Setups
Result Scanner
Quarterly results → result score, risk map & trading bias.
Scan raw result numbers in seconds and understand result quality, risk zone, growth strength, and post-result reaction bias without manually decoding every parameter.
5+Result Views
Live ScoreQuality in milliseconds
Bias SetupPost-result trading view
Result Scanner Output
Mar 2026
RevenueProfitEPSMarginRisk
What it does
One result, multiple easy-to-read views.
Instead of manually checking revenue, profit, EPS, margin, and trend values one by one, the tool packages the result into structured cards that are ready for website, YouTube, Instagram, and client explanation.
Overall Result Score
Evaluates all relevant parameters and quickly classifies the result quality as Poor, Average, Stable, Excellent, etc., while also showing a corresponding score.
Decision Map
Shows risk and potential reward context around the current price using result quality, profit trend, margin pressure, and reaction-risk signals.
Growth & Trend Visuals
Creates clean QoQ and YoY growth snapshots so viewers can understand the result in seconds.
Sample output preview
See how Result Scanner converts raw quarterly numbers into decision-ready views.
Each output is designed to help traders read result quality, reaction risk, growth strength, and post-result trading bias quickly—without manually decoding every parameter.
Score
Overall Result Score
Evaluates all relevant result parameters within milliseconds and classifies result quality as Poor, Average, Stable, Excellent, etc., along with a clear score such as 76/100.
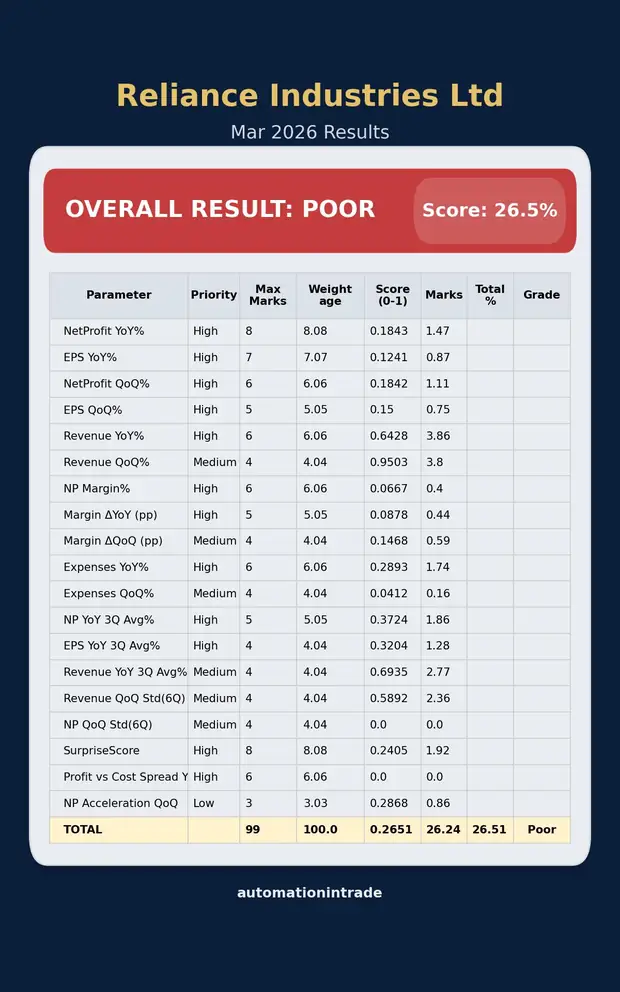
Reliance Industries
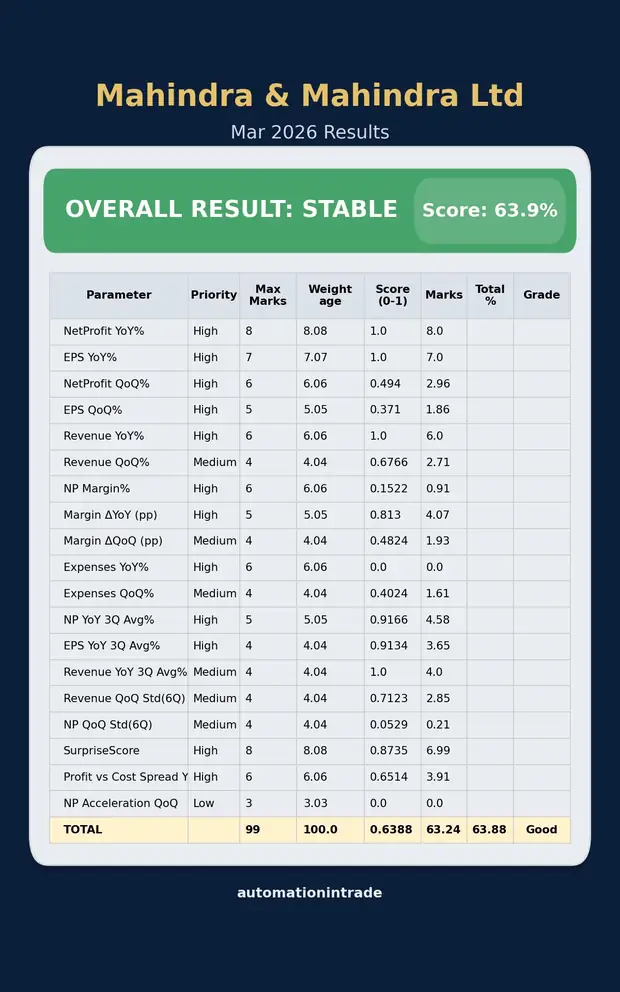
Mahindra & Mahindra
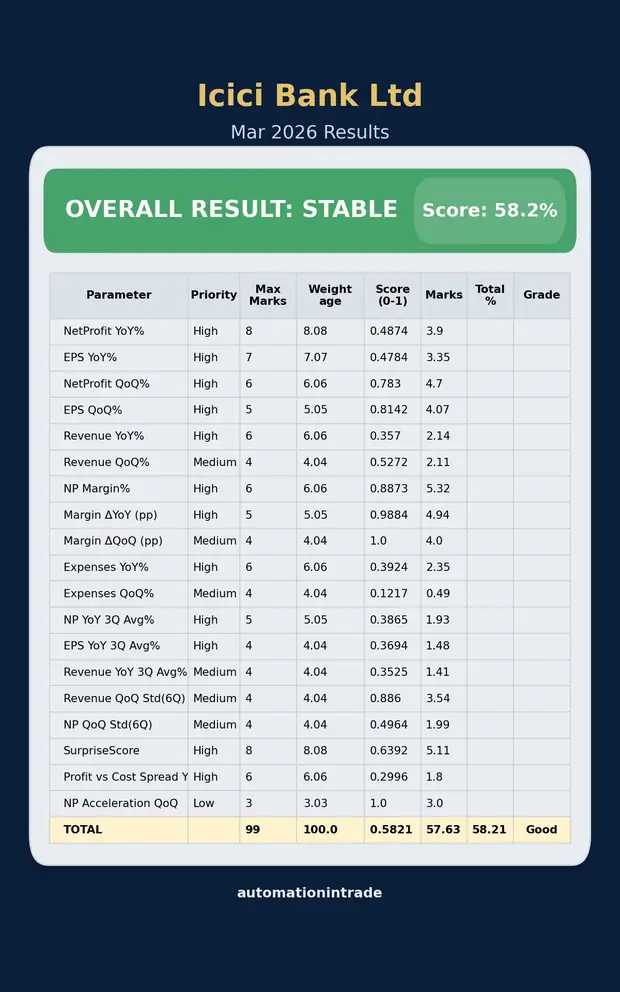
ICICI Bank
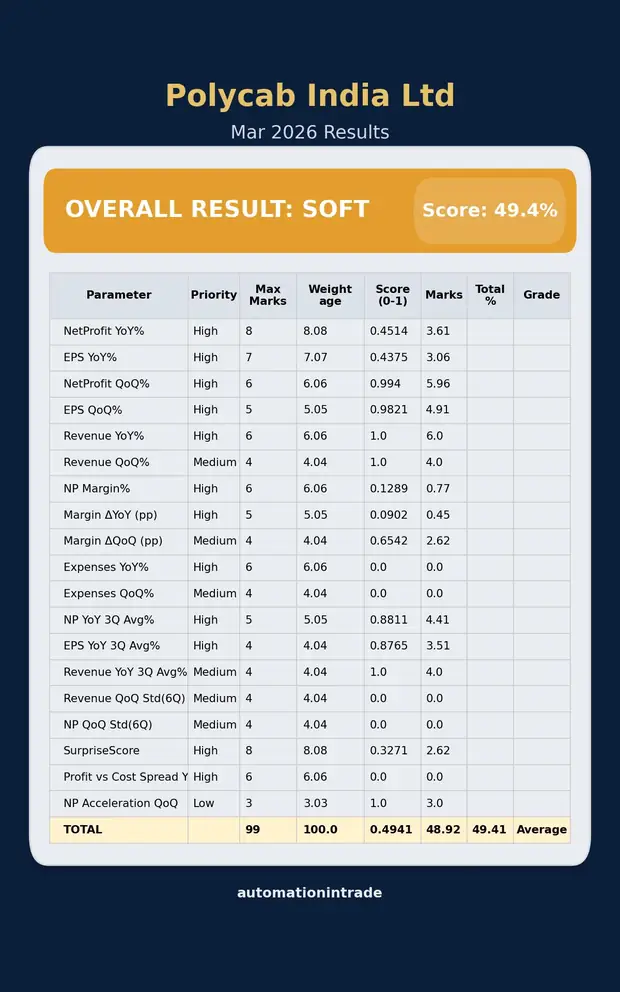
Polycab
Risk Map
Result Decision Map
Indicates the level of risk and potential reward associated with the current price based on result analysis, profit trend, margin pressure, reaction risk, and setup context.
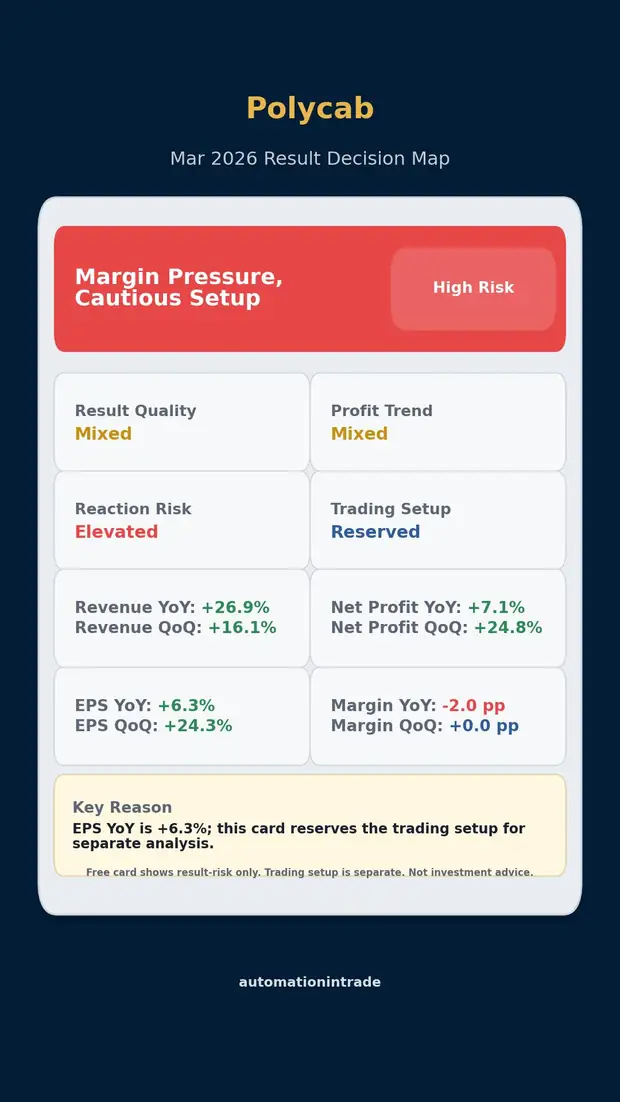
Polycab
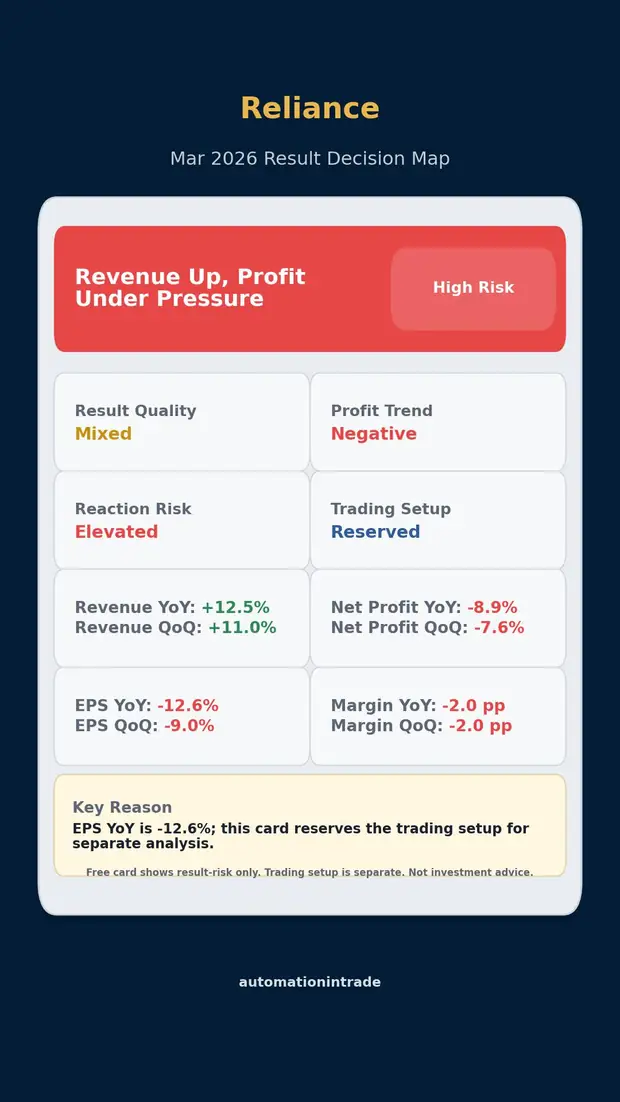
Reliance
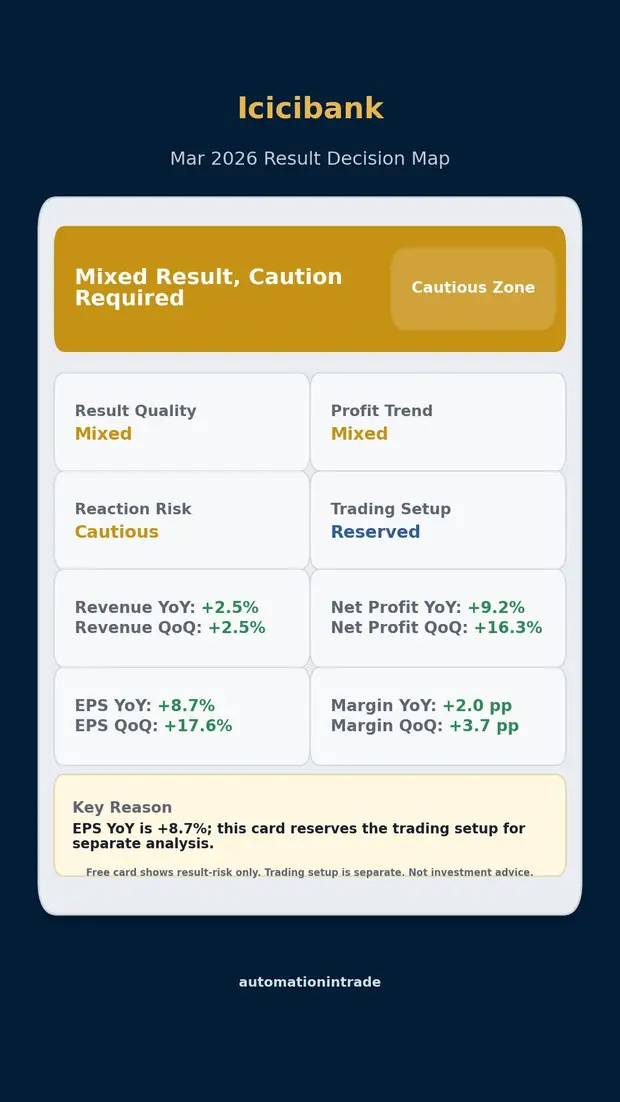
ICICI Bank
Bias
Post-Result Reaction Bias
Helps frame post-result trading setups by showing likely reaction bias based on historical data and result behaviour.
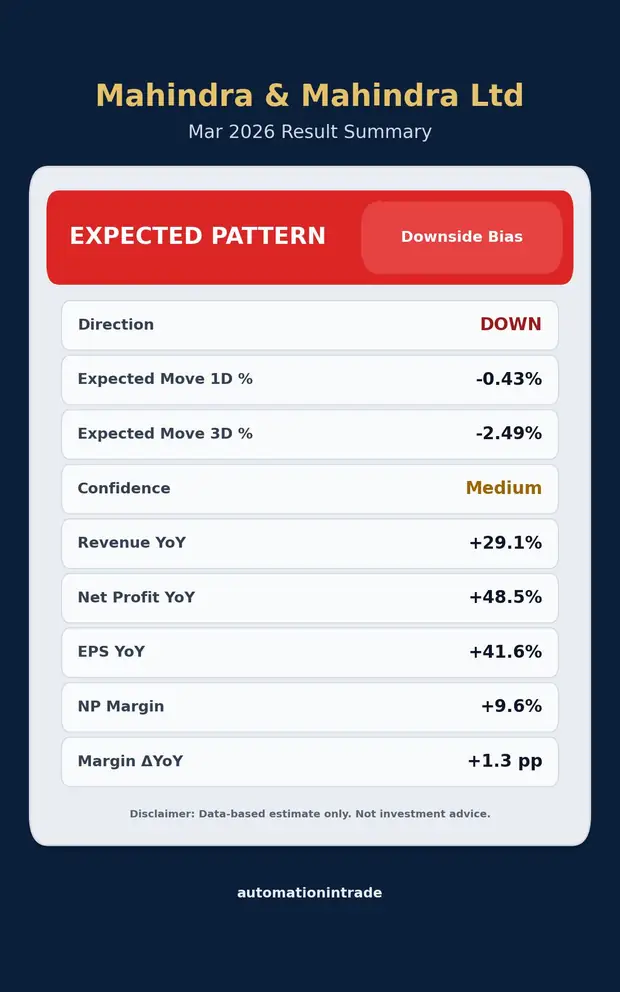
M&M Bias
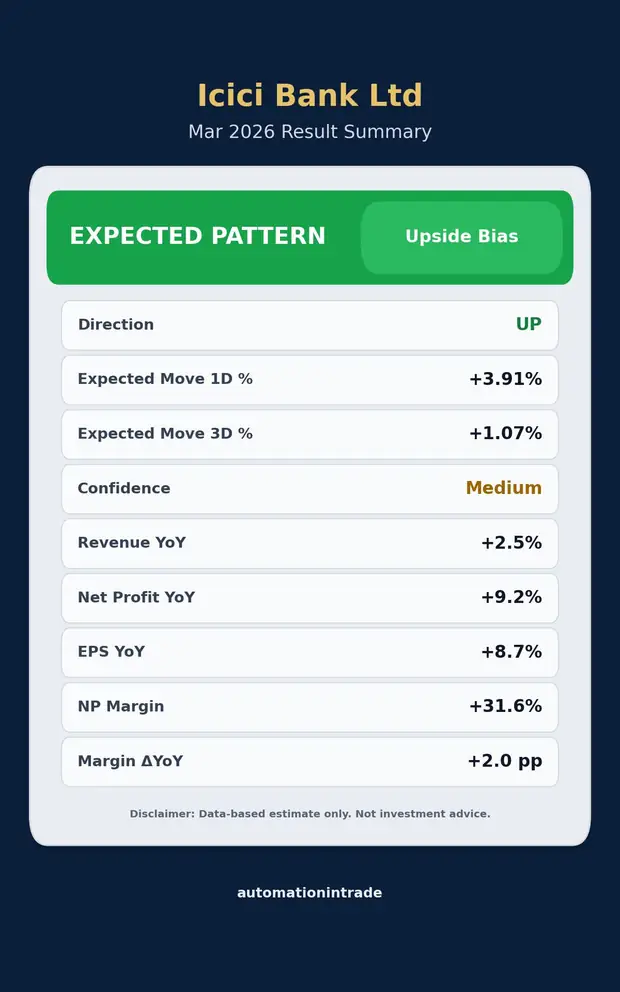
ICICI Bias
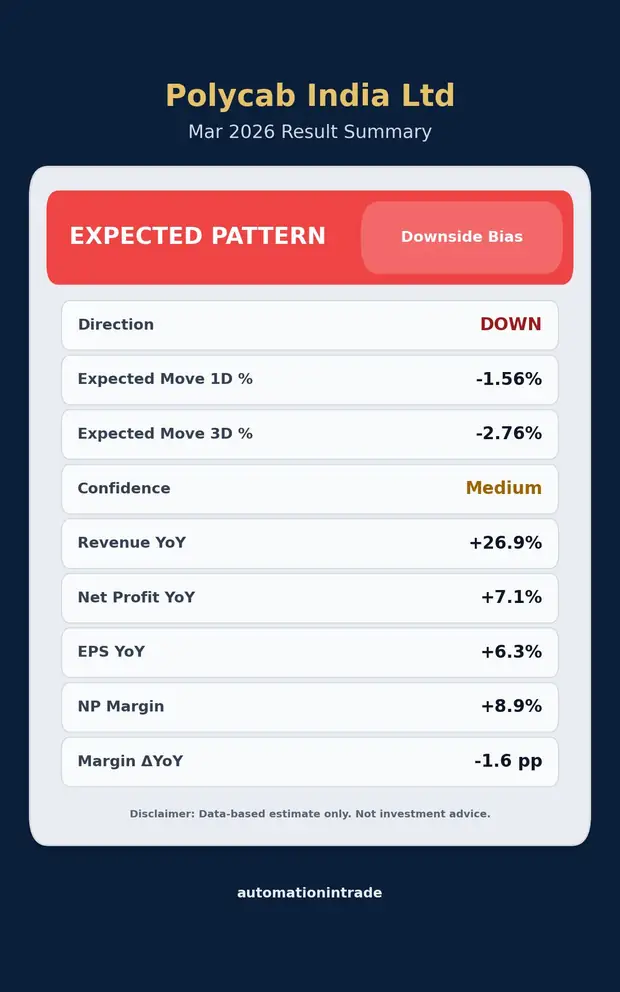
Polycab Bias
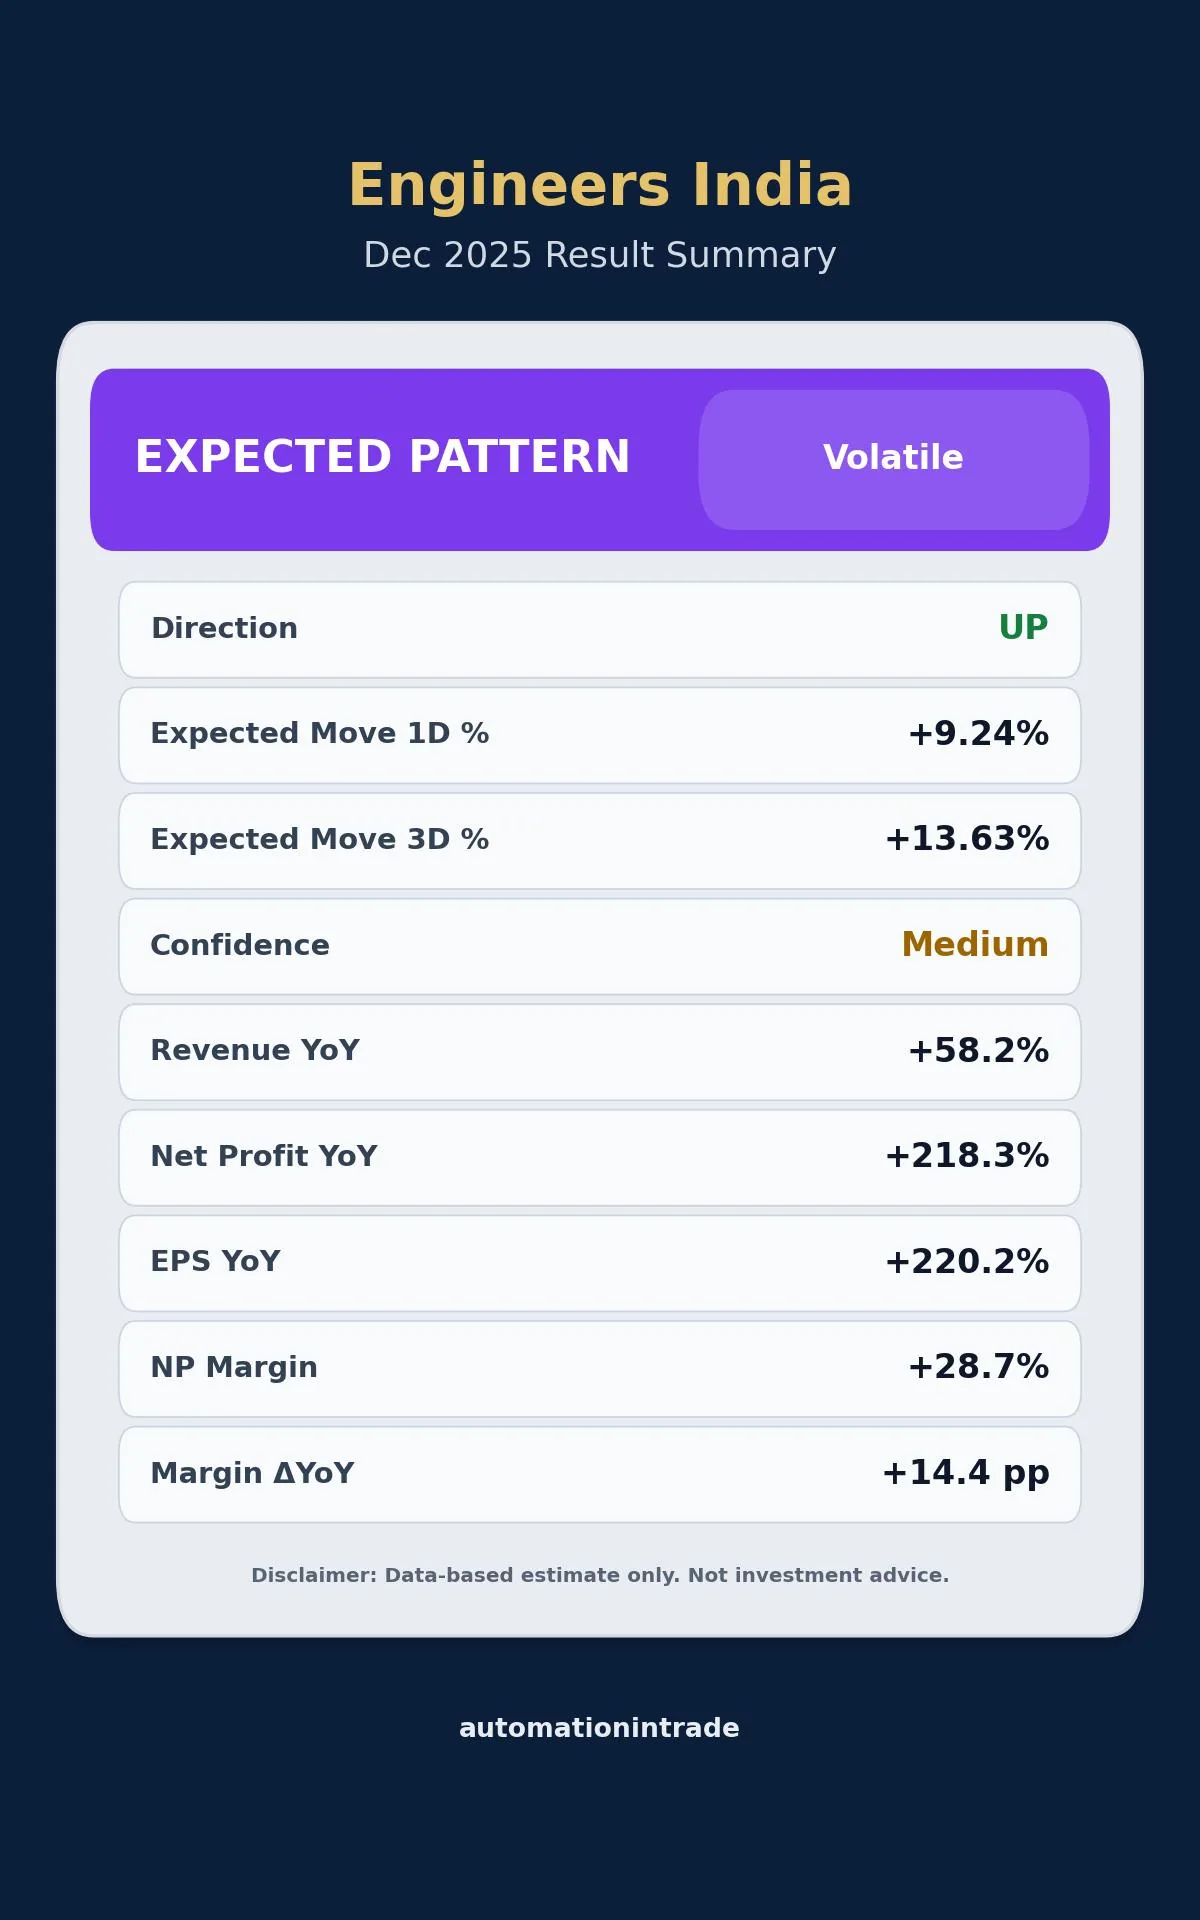
Engineers India Bias
Growth
Growth Snapshot
Quick cards for reading YoY and QoQ growth in sales, profit, and EPS within seconds.
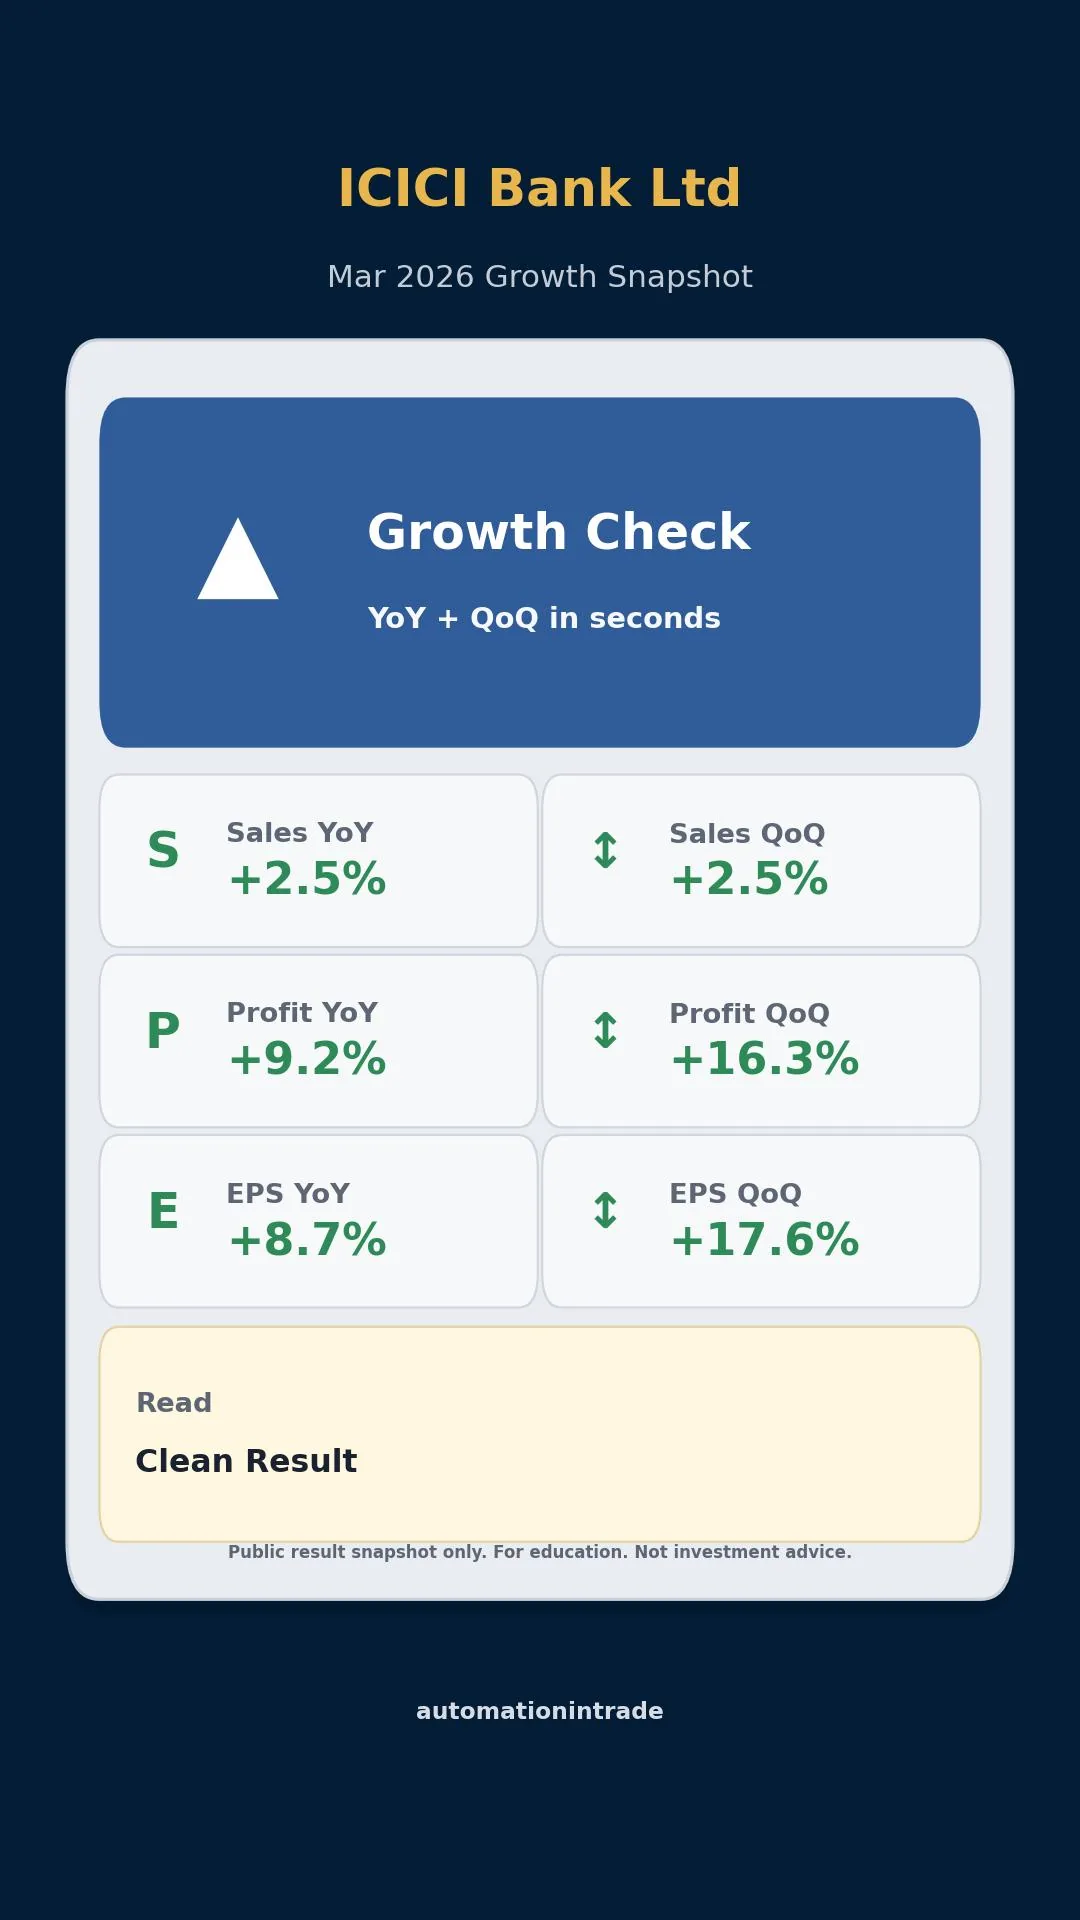
ICICI Growth
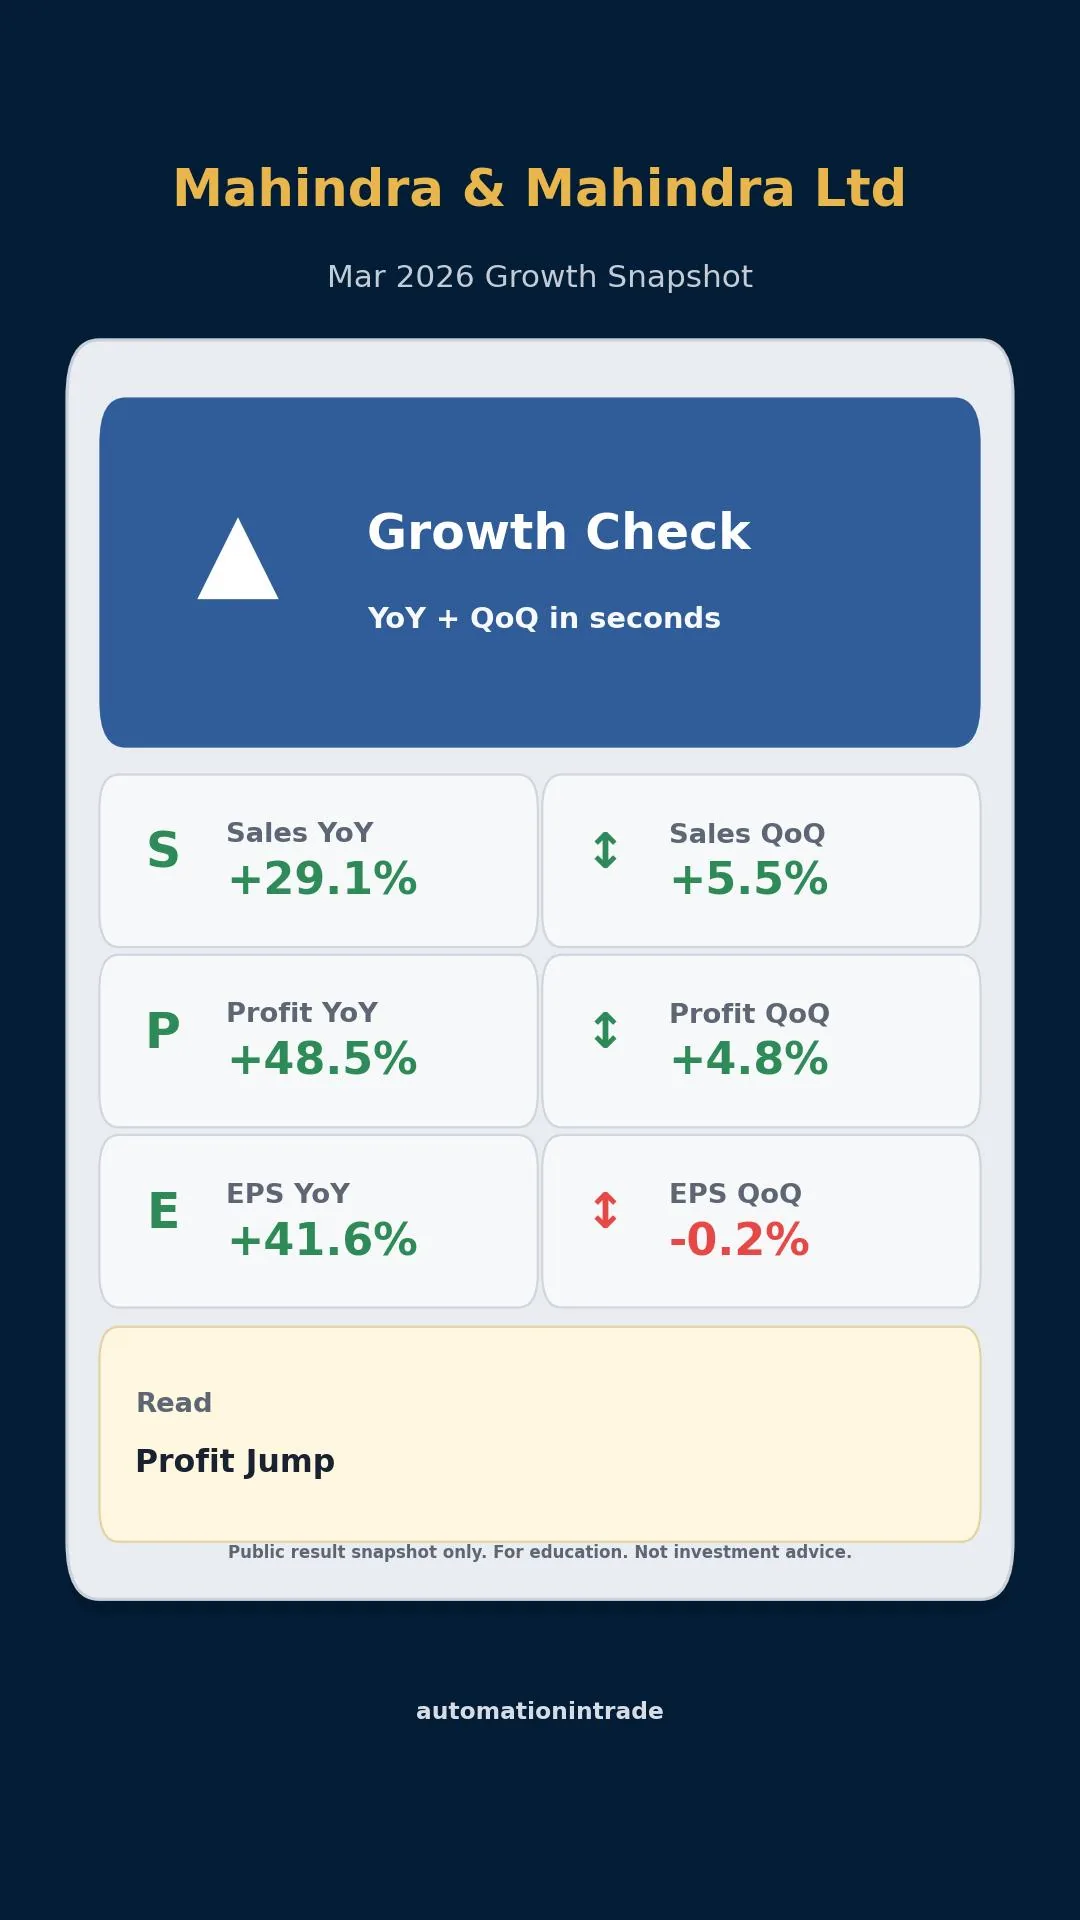
M&M Growth
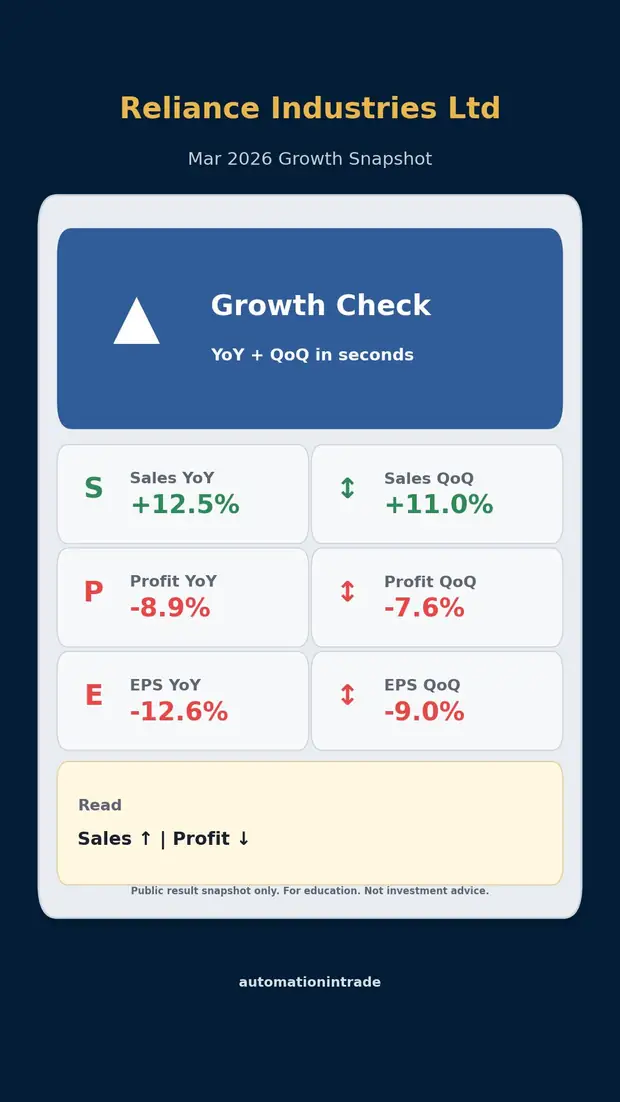
Reliance Growth
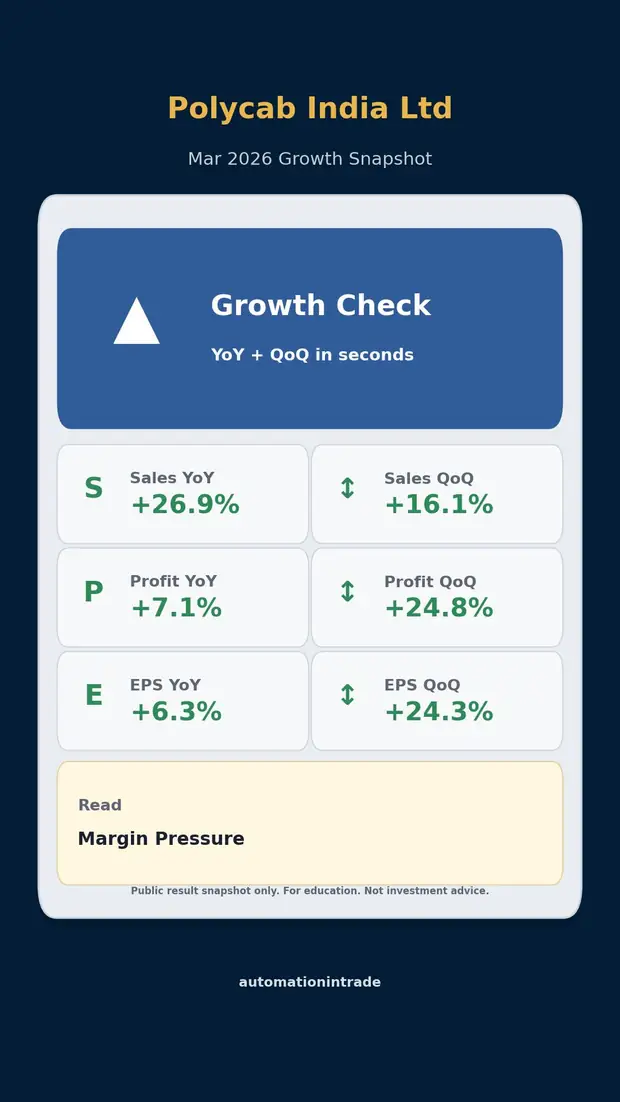
Polycab Growth
Trend
QoQ and YoY Trend Charts
Revenue and profit trend charts for explaining result movement visually.
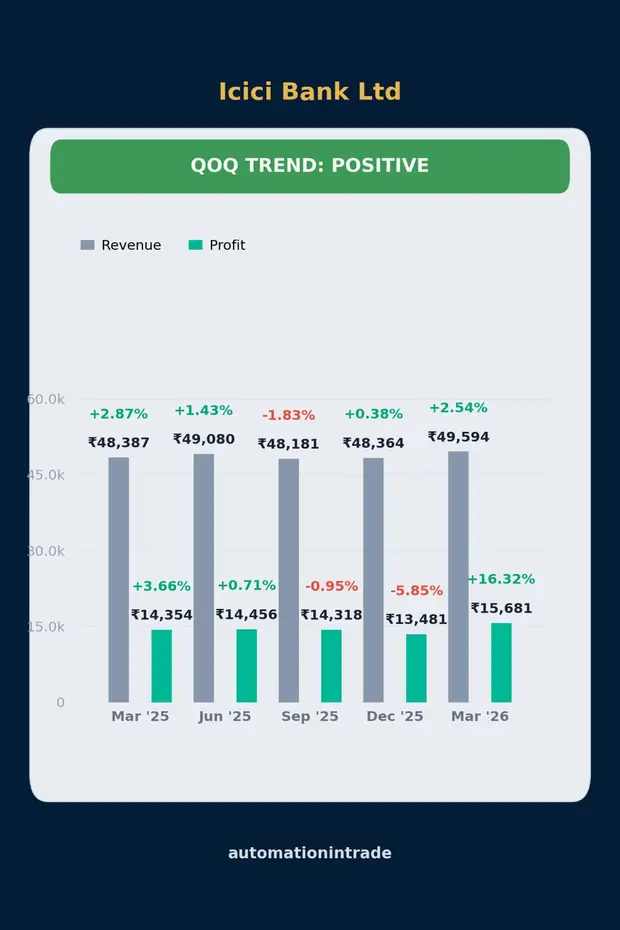
ICICI QoQ Trend
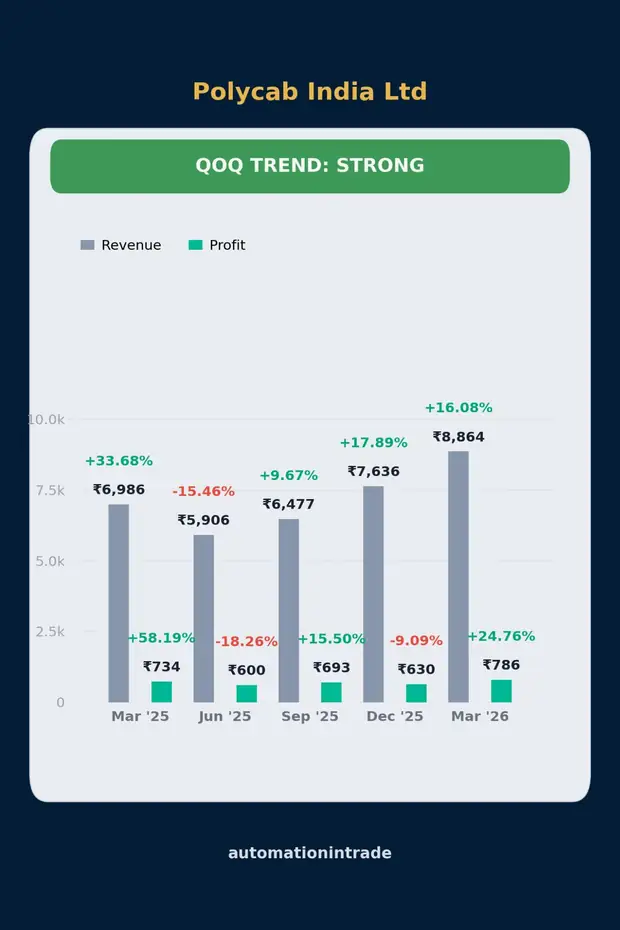
Polycab QoQ Trend
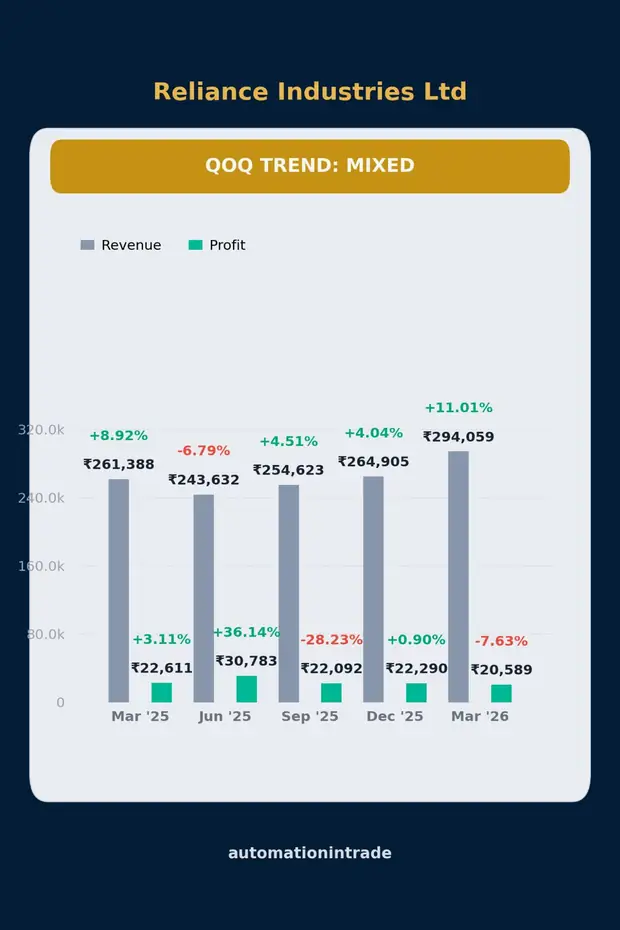
Reliance YoY Trend
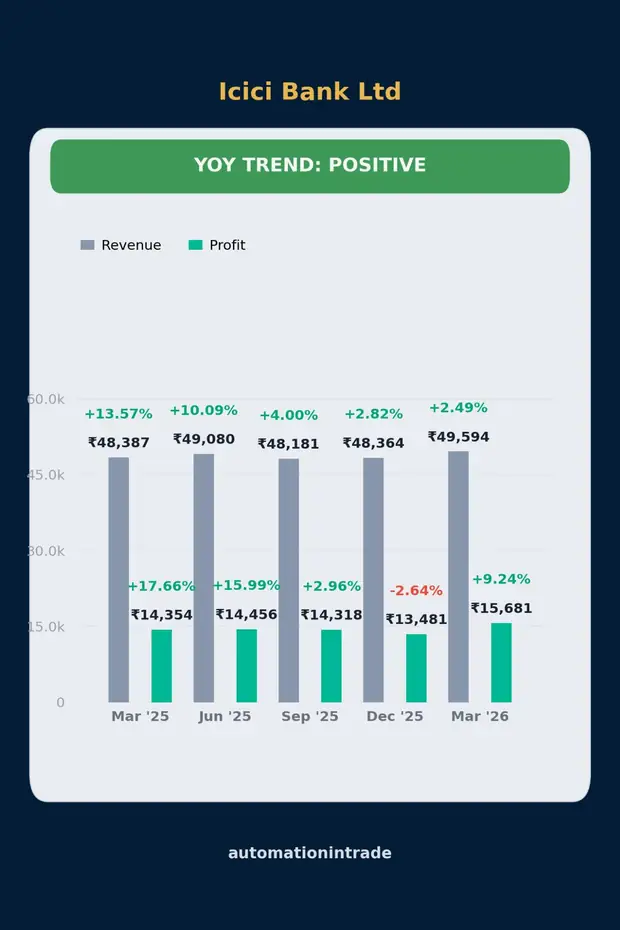
ICICI YoY Trend
Result workflow
From raw quarterly numbers to trader-friendly result views.
Result Scanner helps convert quarterly result data into scorecards, risk maps, reaction-bias cards, and growth snapshots so traders can review result season faster and with more structure.
- Overall result score to quickly compare result quality.
- Post-result reaction bias to help frame trading setups.
- Growth snapshot for YoY and QoQ sales, profit, and EPS reading.
- Decision map to separate result quality, risk, and trading setup.
- Ready-to-use visual cards for website, YouTube, Instagram, and client explanation.
Automation In Trade
Want to explore Result Scanner?
Use the form to request demo access, purchase details, or a custom result automation workflow.