VWAP + price action
Checks whether the stock is trading above or below VWAP and near important support or resistance zones.
Scan stocks with price action, VWAP, RSI, ADX, volume surge and support/resistance logic. The output gives a simple AIT Score, signal, stock mood, buy zone, stoploss, target levels and reasons in both Excel and visual image format.
What it does
The indicator reads 15-minute candle data and calculates core market readings. It then converts those readings into a practical output: bullish, neutral, weak, buy on dip, range bound, trap zone, support/resistance, target and stoploss levels.
Checks whether the stock is trading above or below VWAP and near important support or resistance zones.
Uses RSI, ADX, Plus DI and Minus DI to judge momentum strength and trend confirmation.
Combines multiple readings into a single score with a readable reason column for fast filtering.
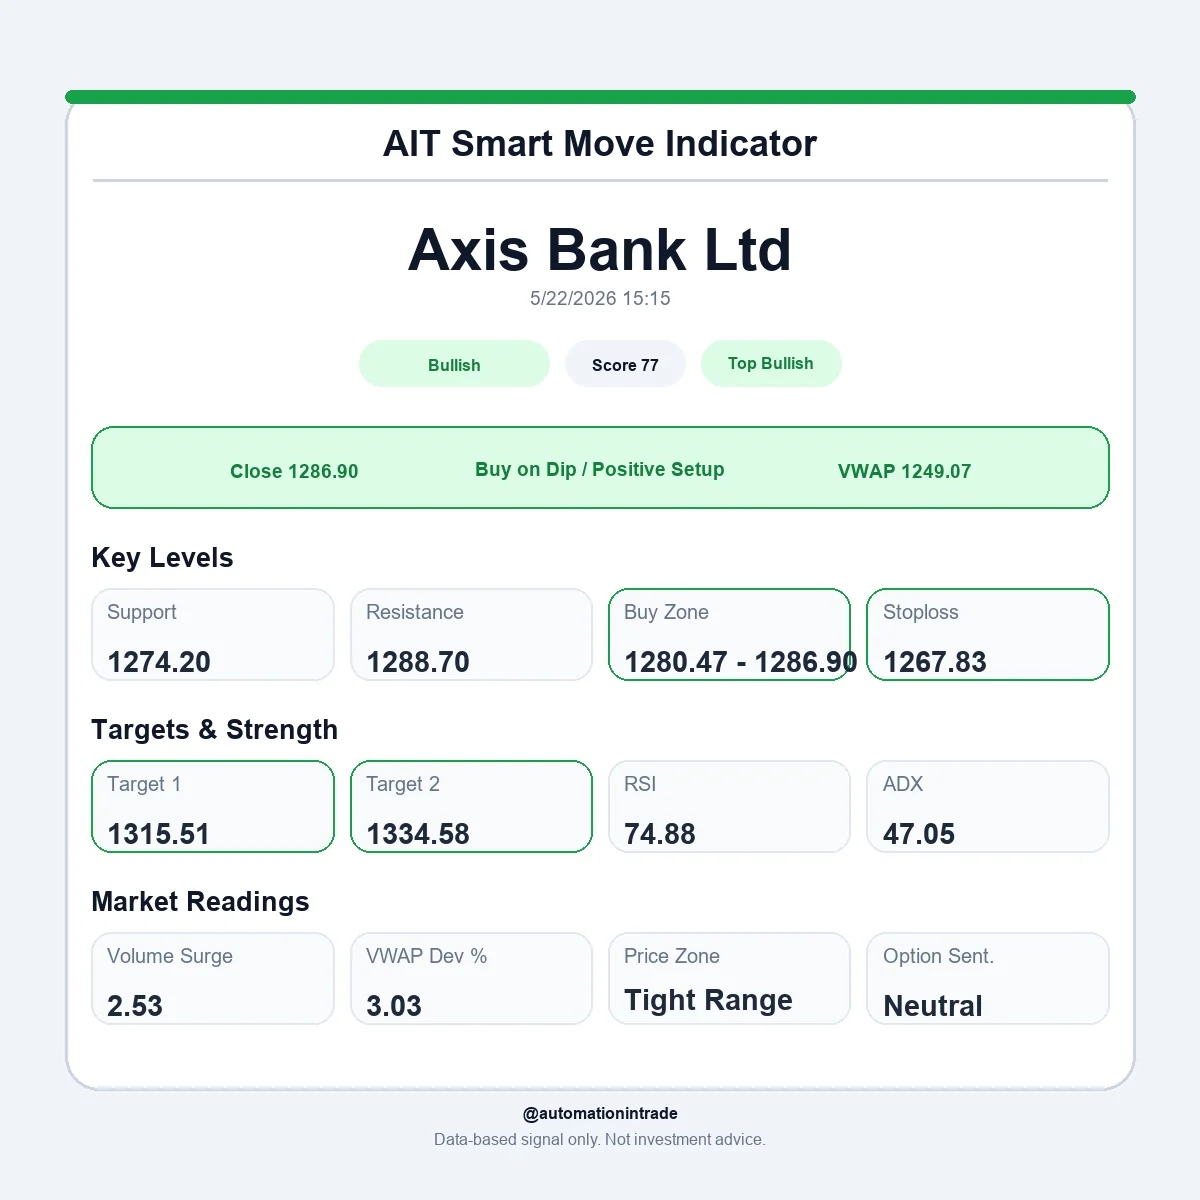
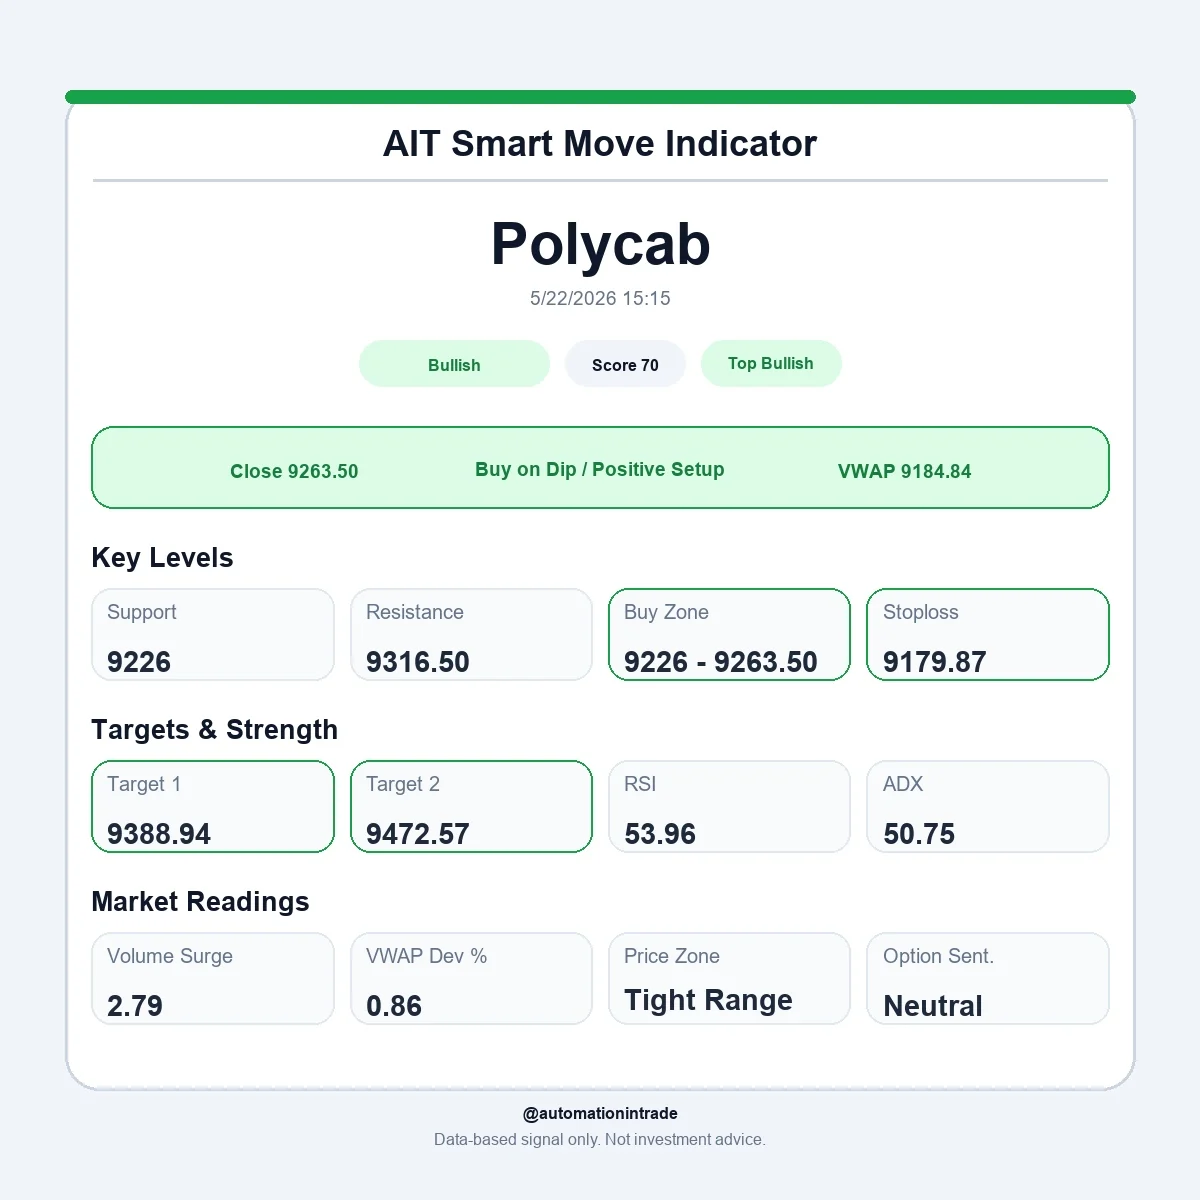
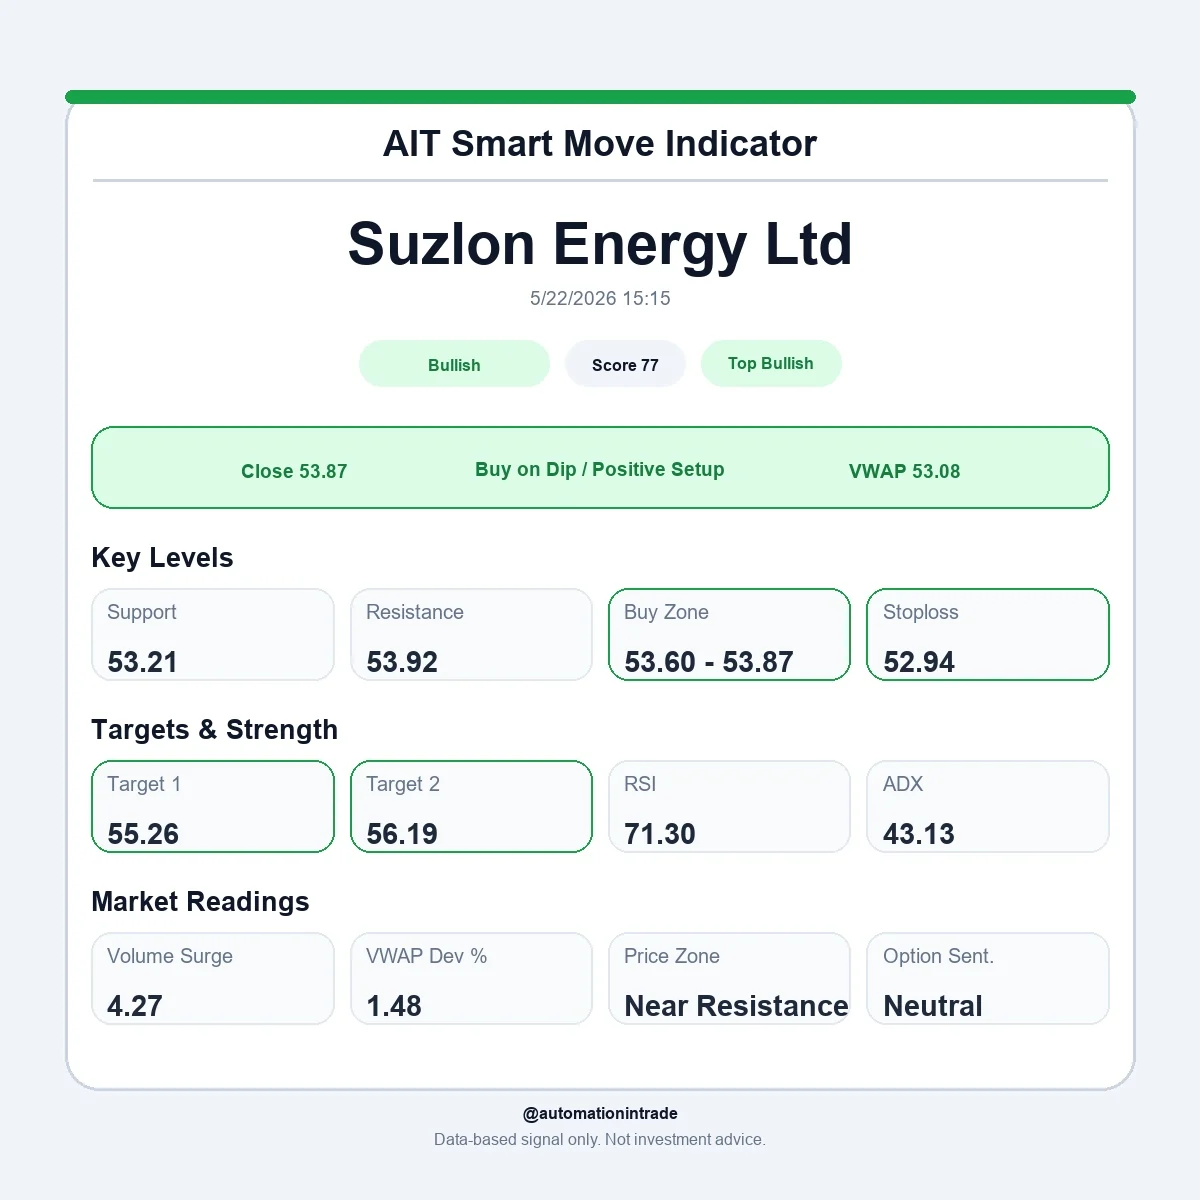
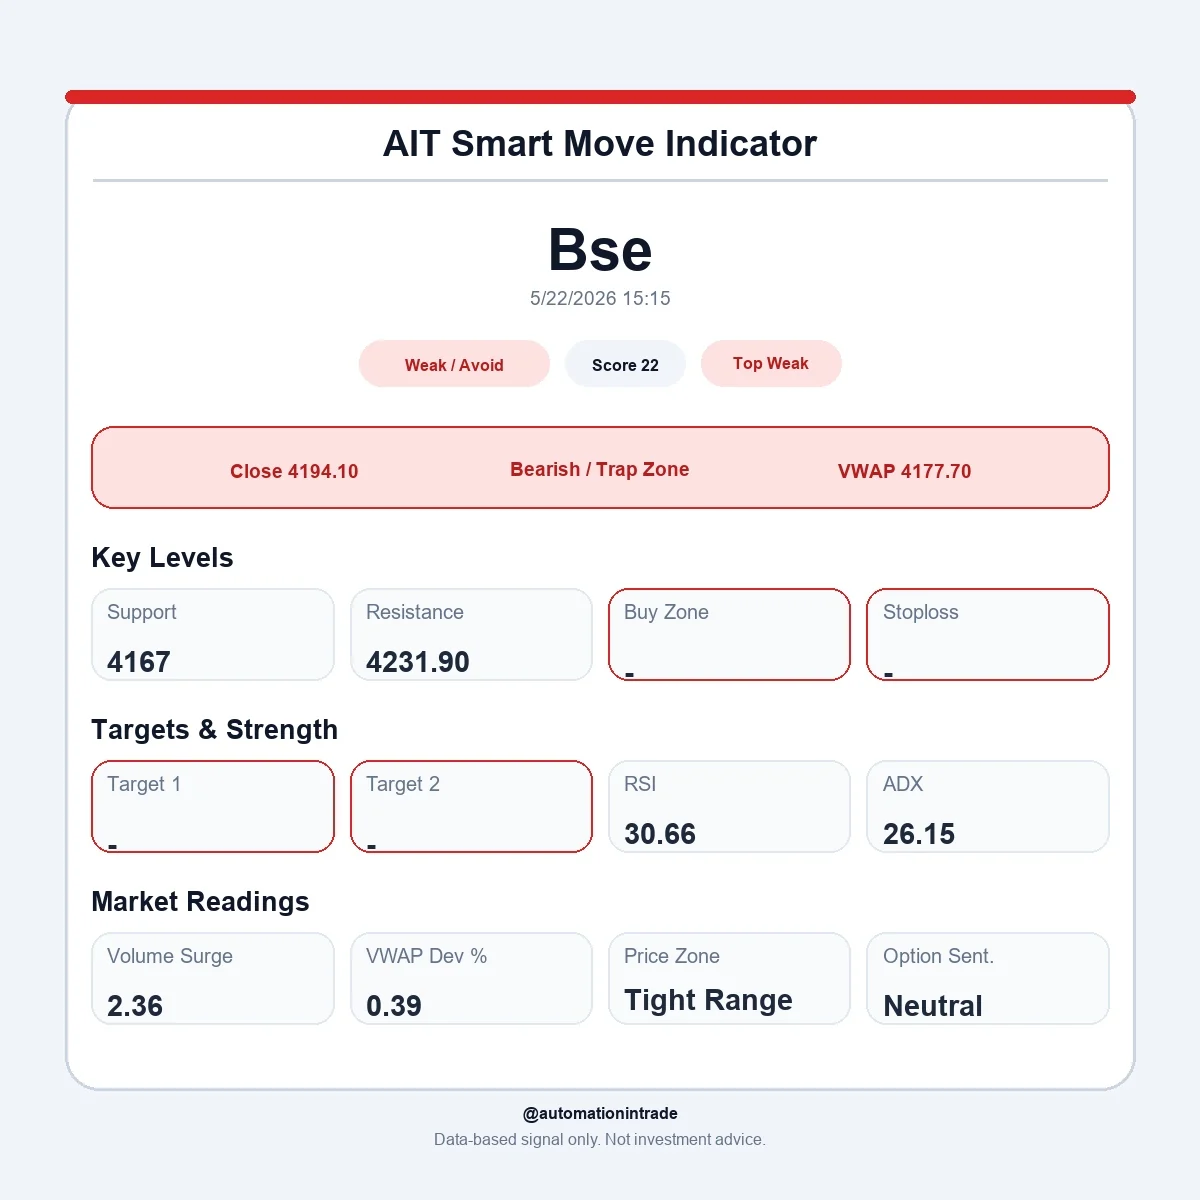
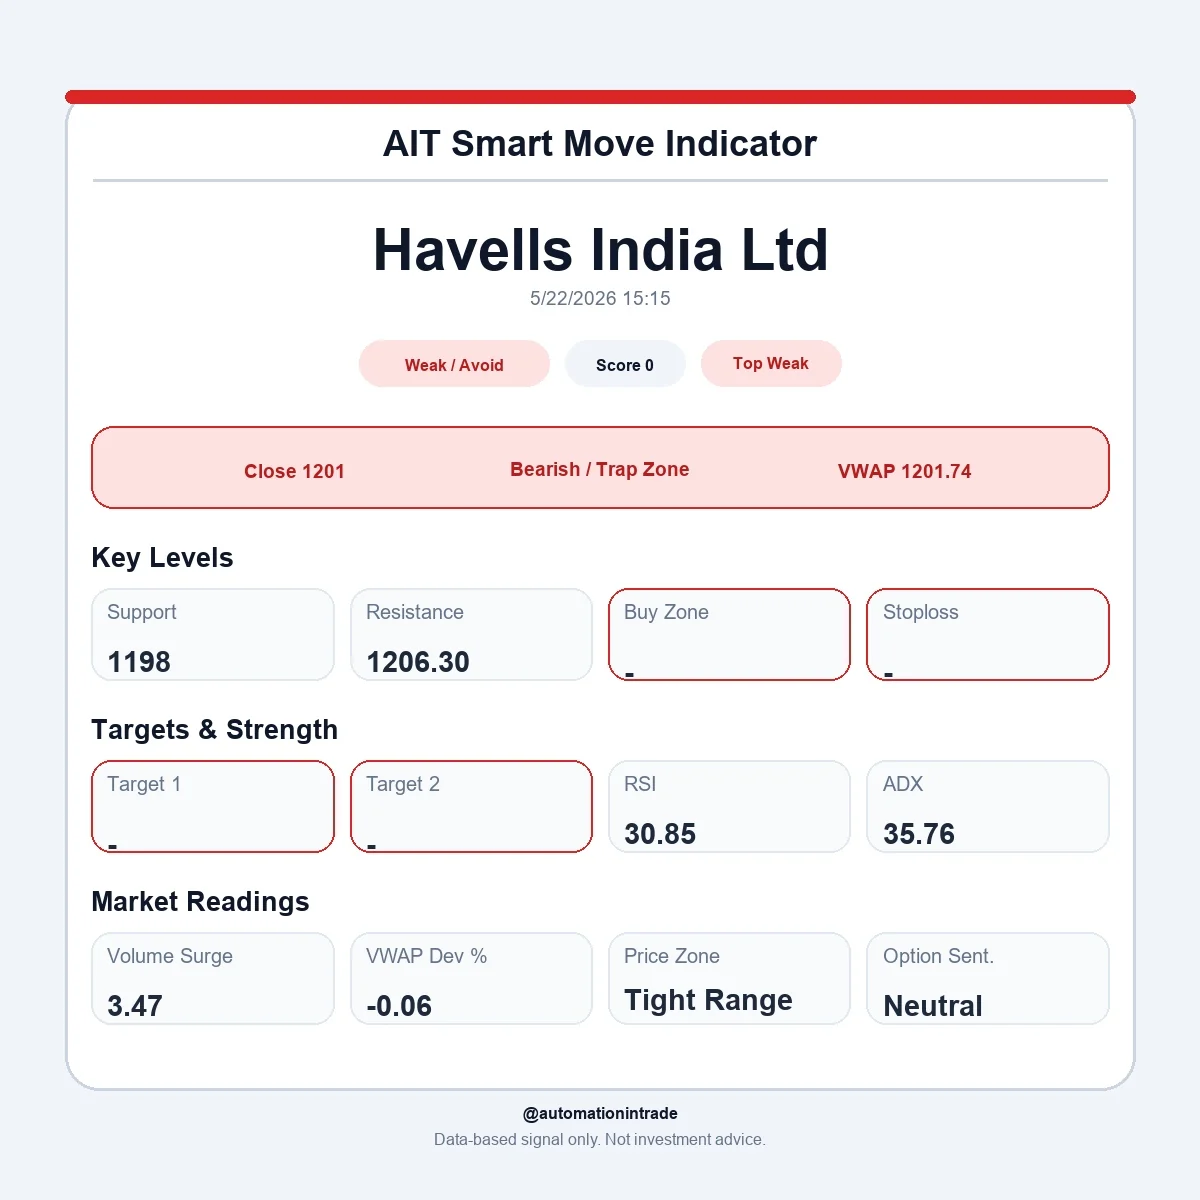
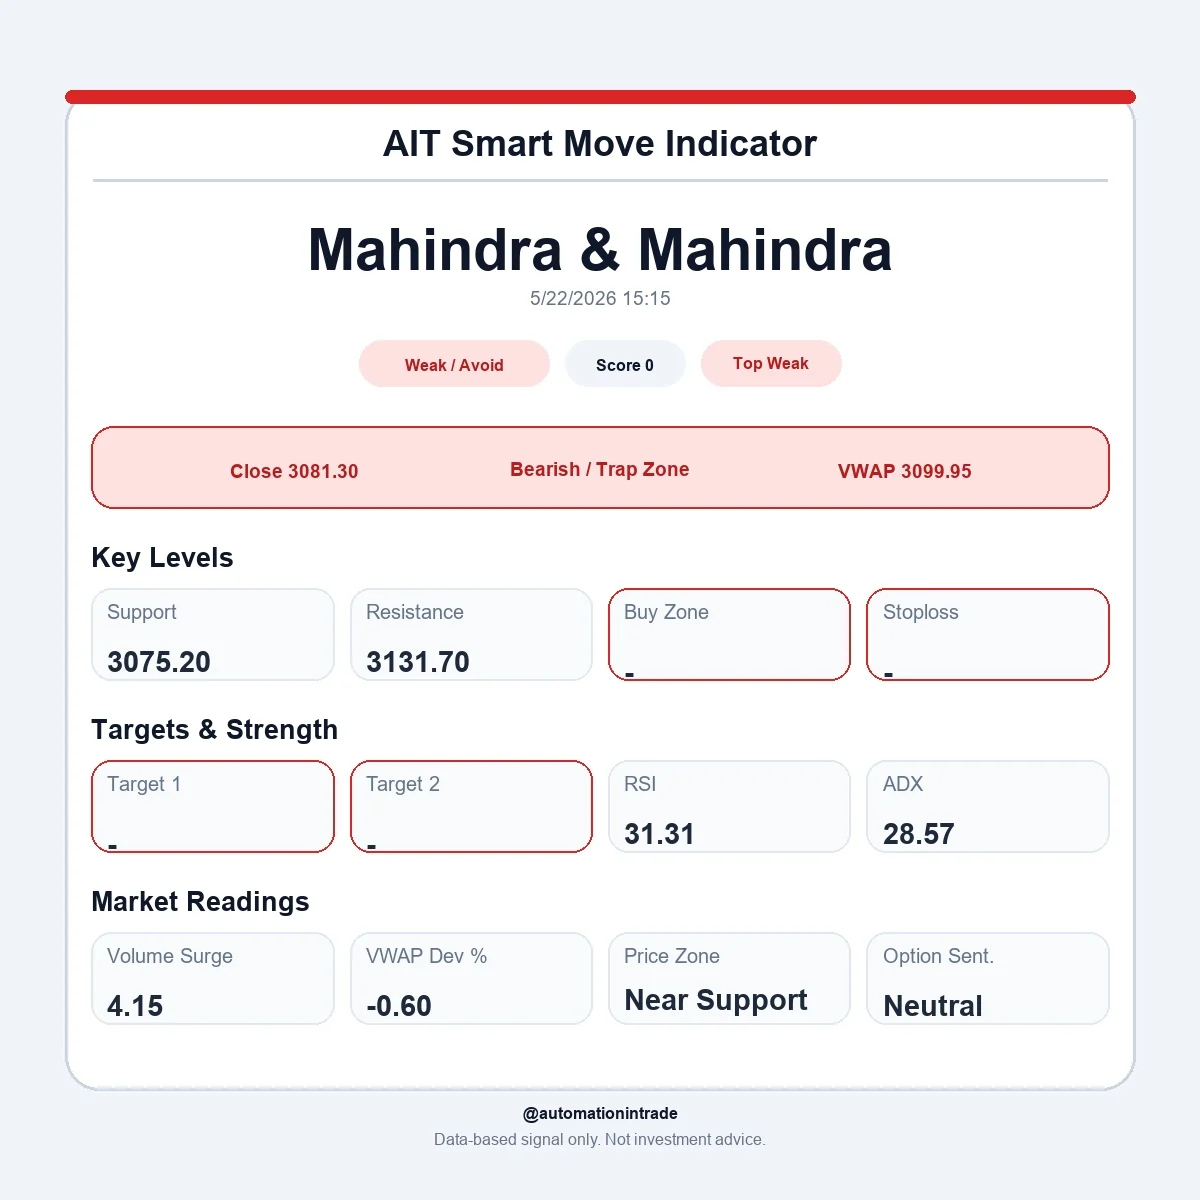
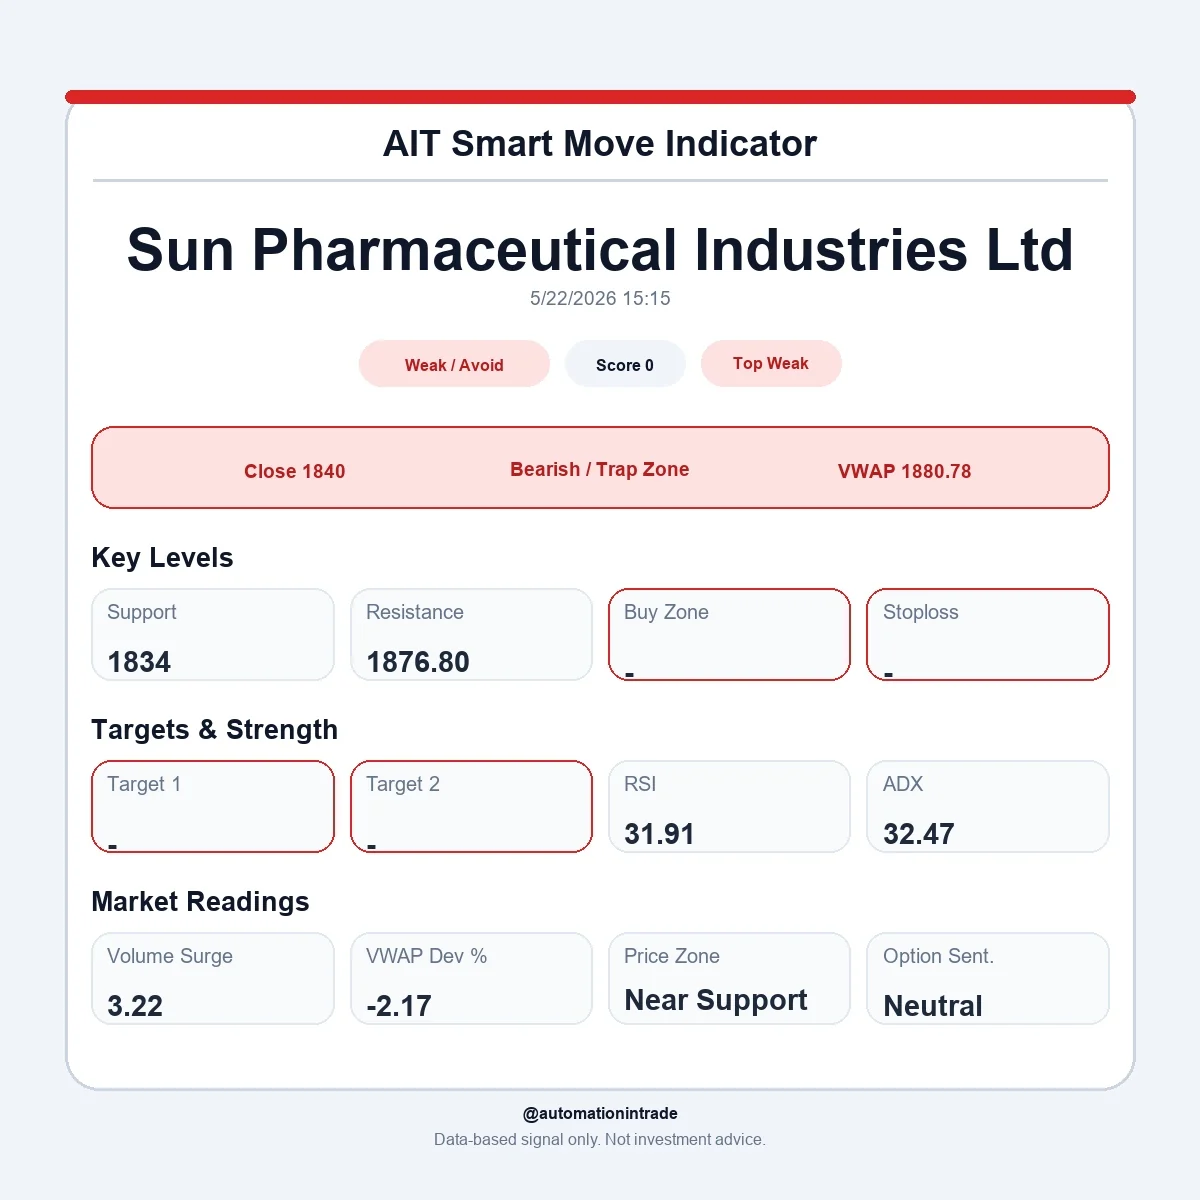
Sample output preview
The Excel output helps you scan many stocks quickly. The image cards convert selected signals into clean Automation In Trade visuals for sharing, review, and decision support.
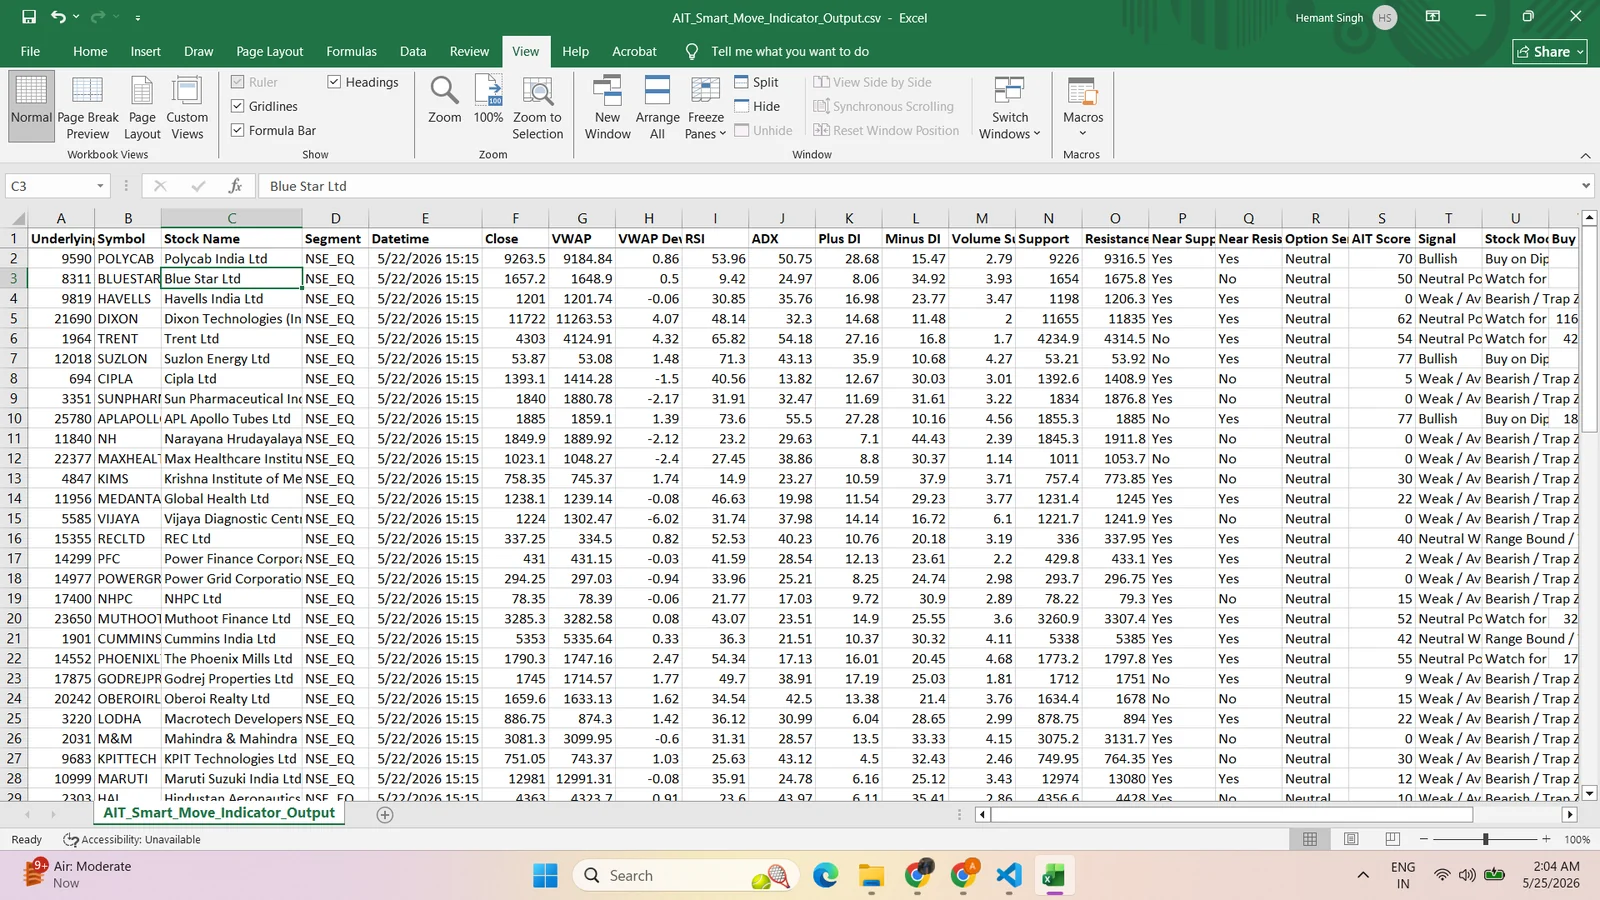
View every stock with symbol, close, VWAP, RSI, ADX, volume surge, support, resistance, signal and AIT score in a single table.
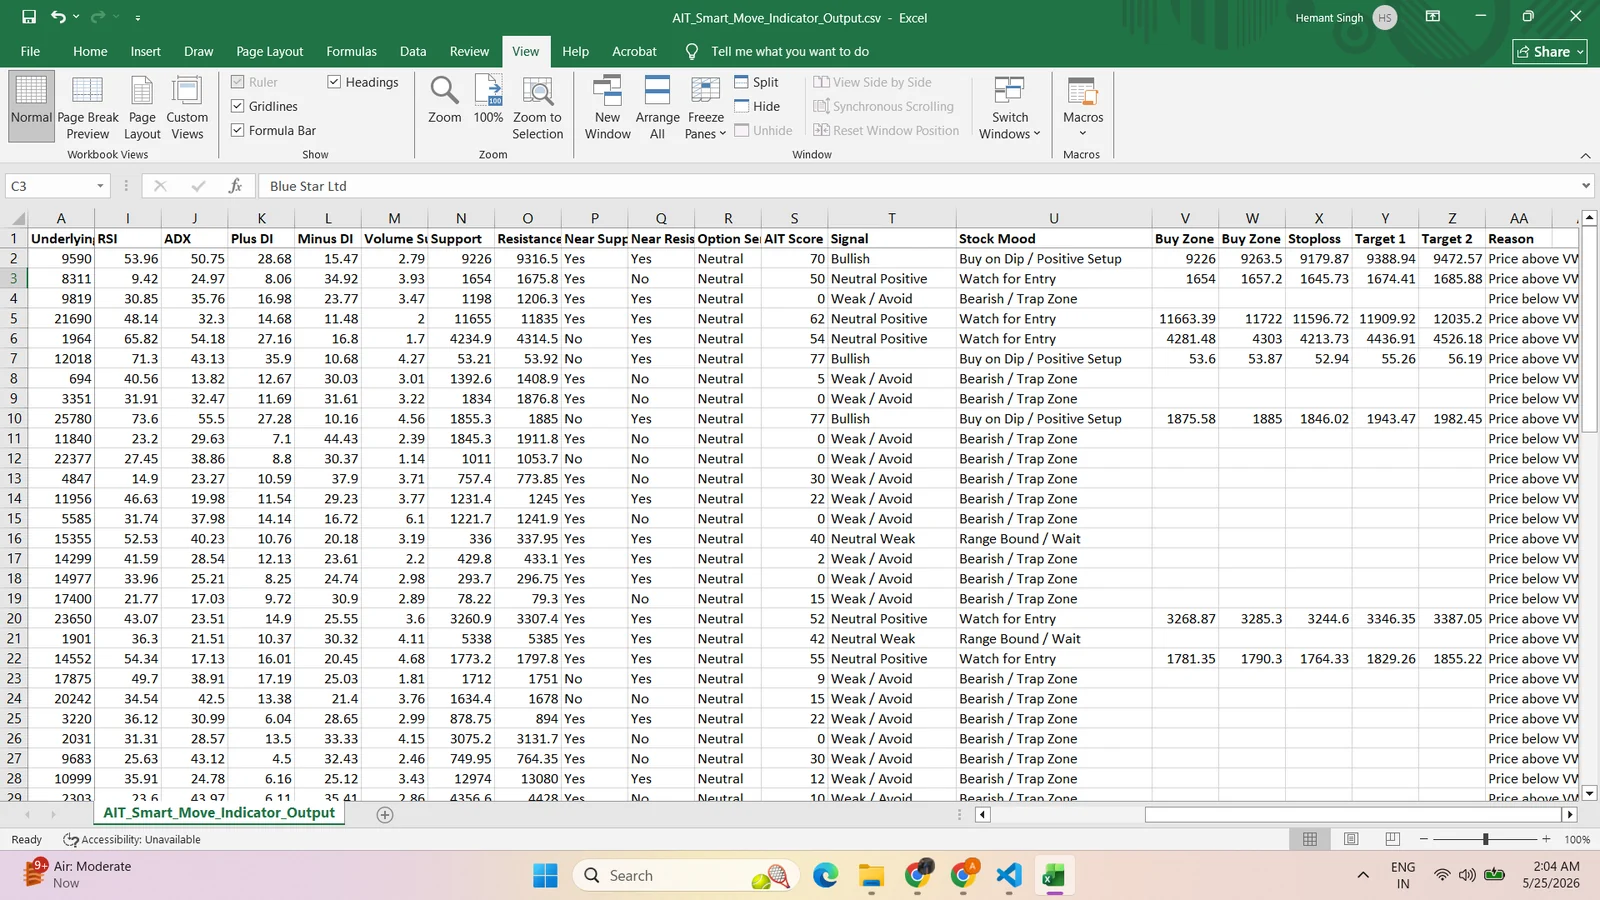
Quickly filter buy zone, stoploss, target 1, target 2, stock mood and reason columns to shortlist actionable setups.

Why use it?
Instead of manually checking VWAP, RSI, ADX, support, resistance and volume for every stock, the indicator creates a direct shortlist. You can use the Excel sheet for bulk scanning and image cards for fast visual review or content publishing.
Automation In Trade
Use the form to request demo access, purchase details, or a custom version for your stock list and trading workflow.