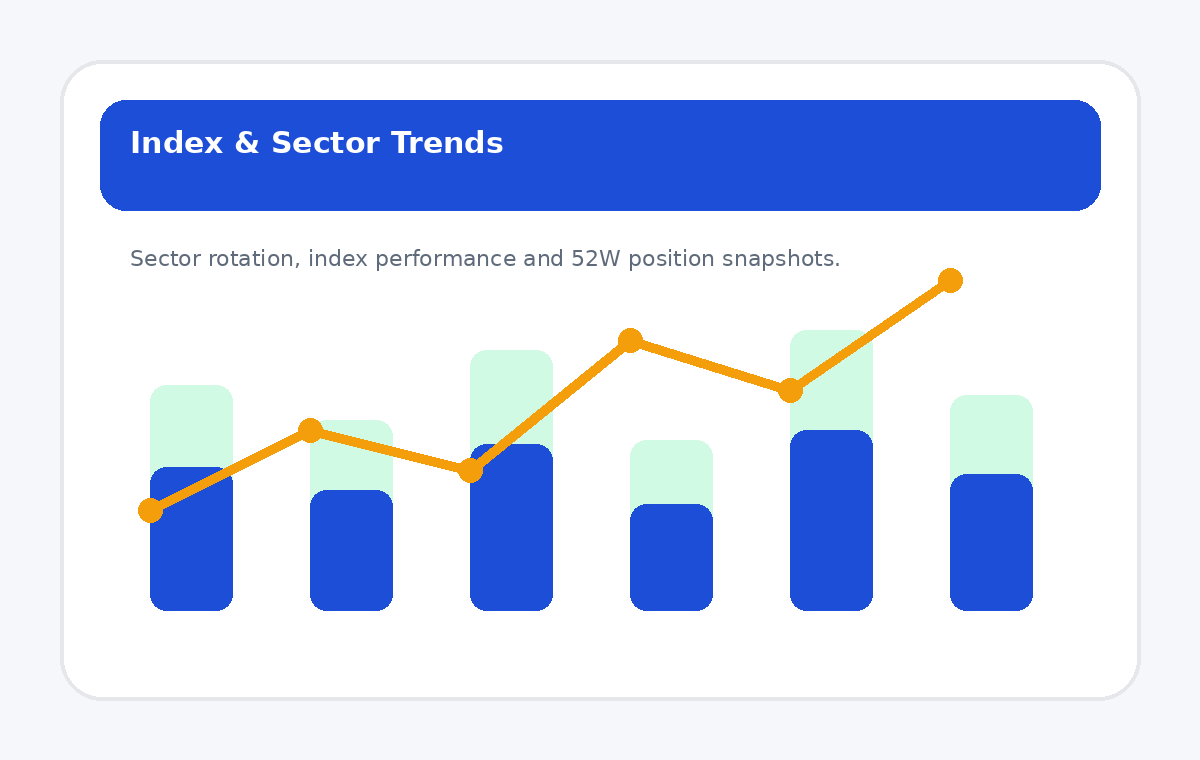
Index & Sector Trends
Index performance, sector rotation, top constituents, and 52-week positioning.
Stock Market Data • Results • Market Mood
Automation In Trade helps traders and investors understand results, sector movement, FII/DII flow, index trends, and stock behaviour through clean data-based insights.
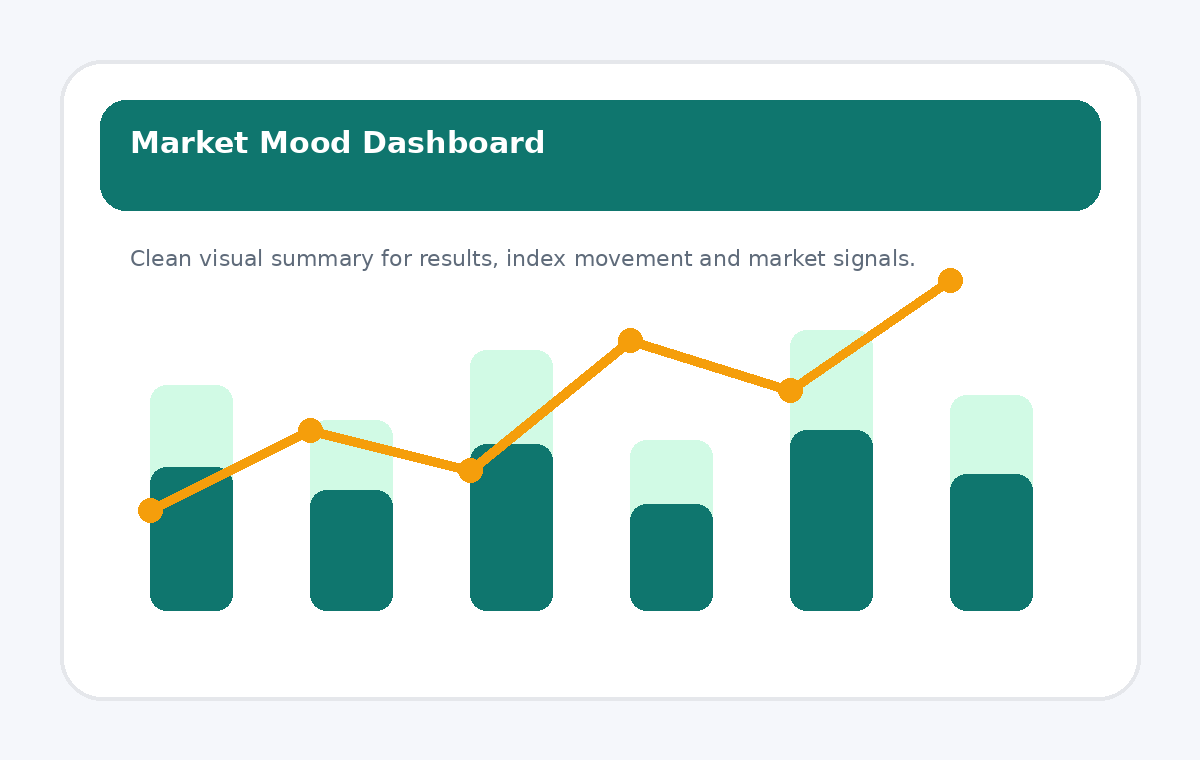
Market mood, result pulse, and index signals simplified for faster reading.
About
Most traders see too much scattered data. Our goal is to convert that data into simple visuals, short summaries, and decision-friendly market snapshots.
Quarterly performance simplified with revenue, profit, margin, and reaction risk.
Short daily summaries covering key market triggers, flows, and sentiment.
Data-driven scripts and visual tools to reduce manual analysis time.
Stock Market Automation Tools
Automation In Trade is built for traders, investors, finance creators and market educators who want faster stock market data interpretation. The homepage connects every major tool, including Result Scanner, Price Action Zone Finder, Option Chain Sentiment Dashboard, Institutional Holding Activity Tracker, Sector Money Flow Tracker and News Card Generator.
Free Stock Market Tools
Use lightweight market tools to view full index performance, sector-wise 52-week high-low position, current price distance from yearly highs, 1-day change, and stocks trading near important price zones.
Content
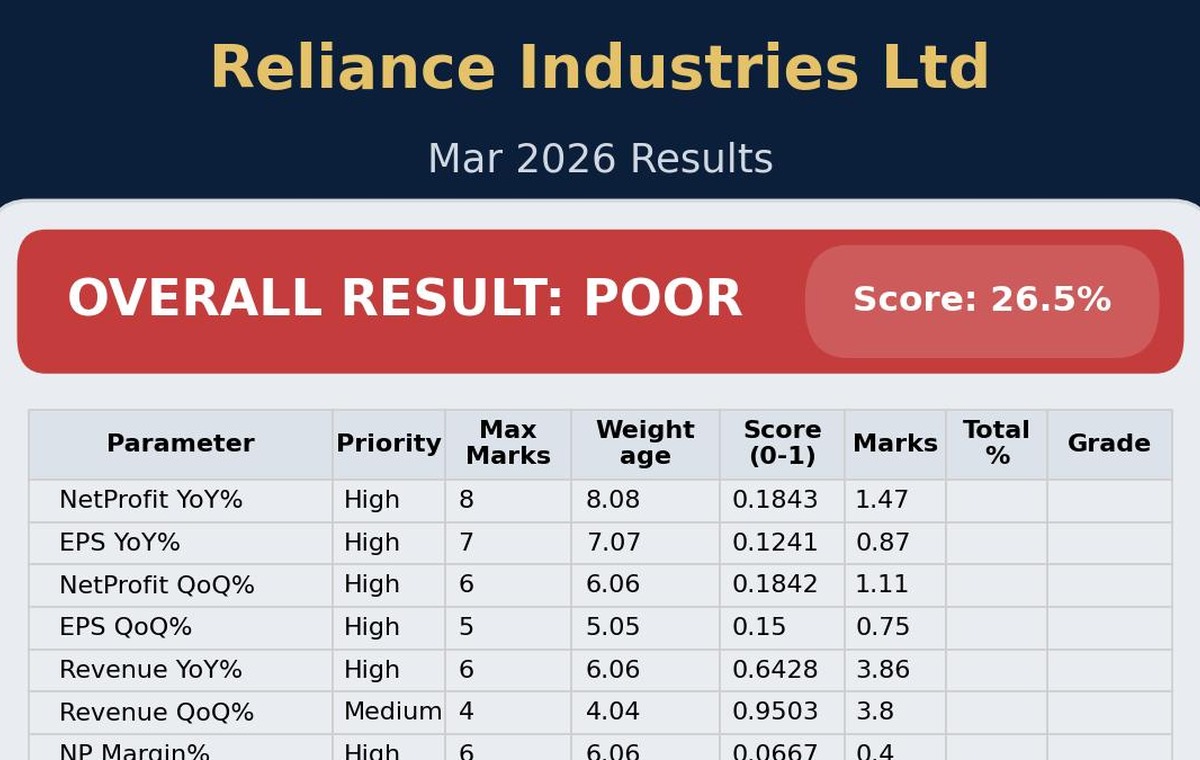
Company result snapshots with a clear red/green decision box, overall score, YoY/QoQ growth, profit trend, and risk summary.
Index performance, sector rotation, top constituents, and 52-week positioning.
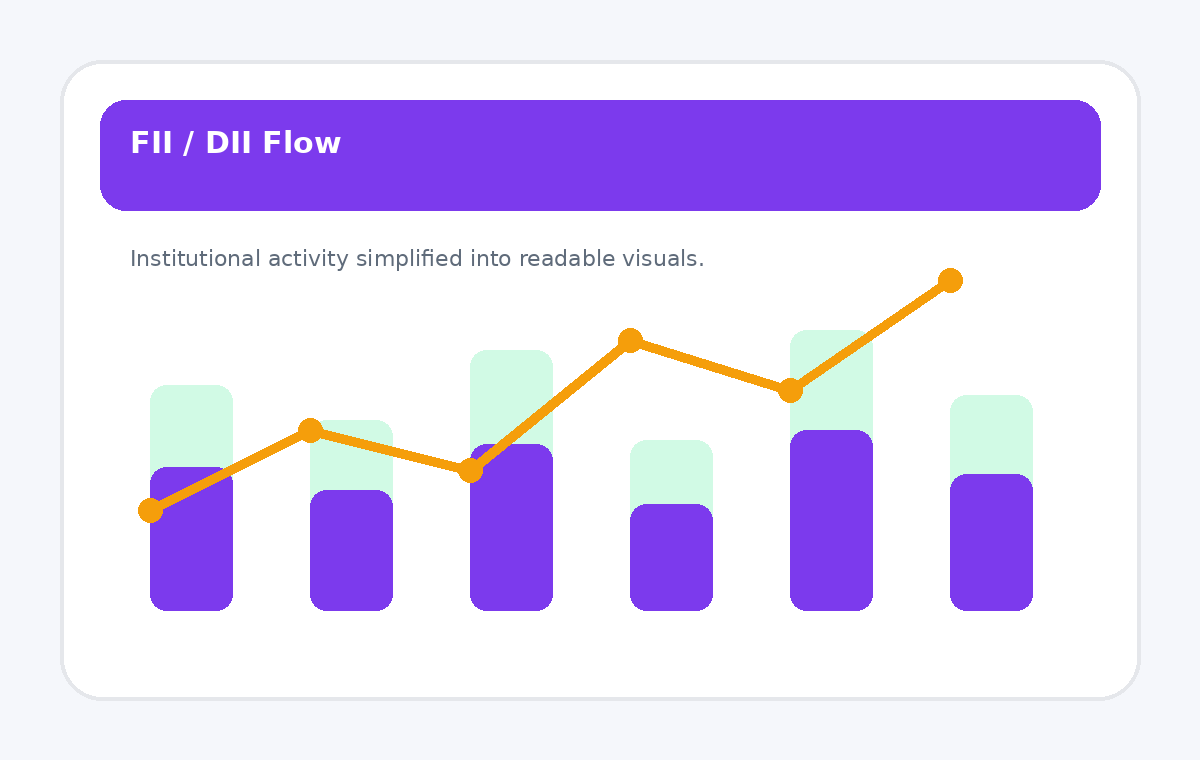
Institutional activity presented in simple visuals for faster market context.
Tools
We also build scripts that convert raw stock market data into social-media-ready charts, cards, and dashboards. Useful for creators, traders, and market educators.
Part of Result Scanner: converts result data into a clean overall score for fast comparison.
02Part of Result Scanner: converts result quality into a simple decision-friendly risk map.
03Single-click stock news card with headlines, brokerage Buy/Sell calls, target prices, and more.
04Generates Instagram and YouTube-ready cards directly from quarterly result data.
05Scans NSE stocks to find major QoQ holding increases and decreases by MF, FII, promoters, and retail investors.
06Displays Buy, Sell/Target, and Stop-Loss zones directly on technical charts.
07Summarizes sentiment using PCR, OI change, Max Pain, and IV Skew.
08Identifies sectors witnessing current buying or selling flows.
09Visualizes institutional buying and selling activity in simple image and reel formats.
10Free 52-week high-low market tools for NIFTY IT, Auto, Bank, Pharma and FMCG stocks.
11Creates a portfolio quality scorecard with good, monitor and poor stock sections, AIT score, grade, quality, growth, valuation, upside and risk view.
12Scores stock mood using VWAP, RSI, ADX, volume surge, support/resistance, buy zone, stoploss and targets.
13Real-time buy zone, stop-loss, target, and trend levels using price action.
Connect
For market visuals, daily updates, and automation-based stock market insights, connect with Automation In Trade across all official channels.