Portfolio ScoreQuality ViewRisk Filter
Portfolio Analyzer
Convert your holdings into a clean portfolio quality scorecard.
Portfolio Analyzer helps traders and investors review multiple holdings in one screen. It highlights AIT Score, grade, quality, growth, valuation, upside and risk so good stocks, monitor stocks and poor stocks can be identified faster.
AIT Score0–100 portfolio view
Quality TagsGood, monitor, poor
Visual OutputExcel and image cards
How it works
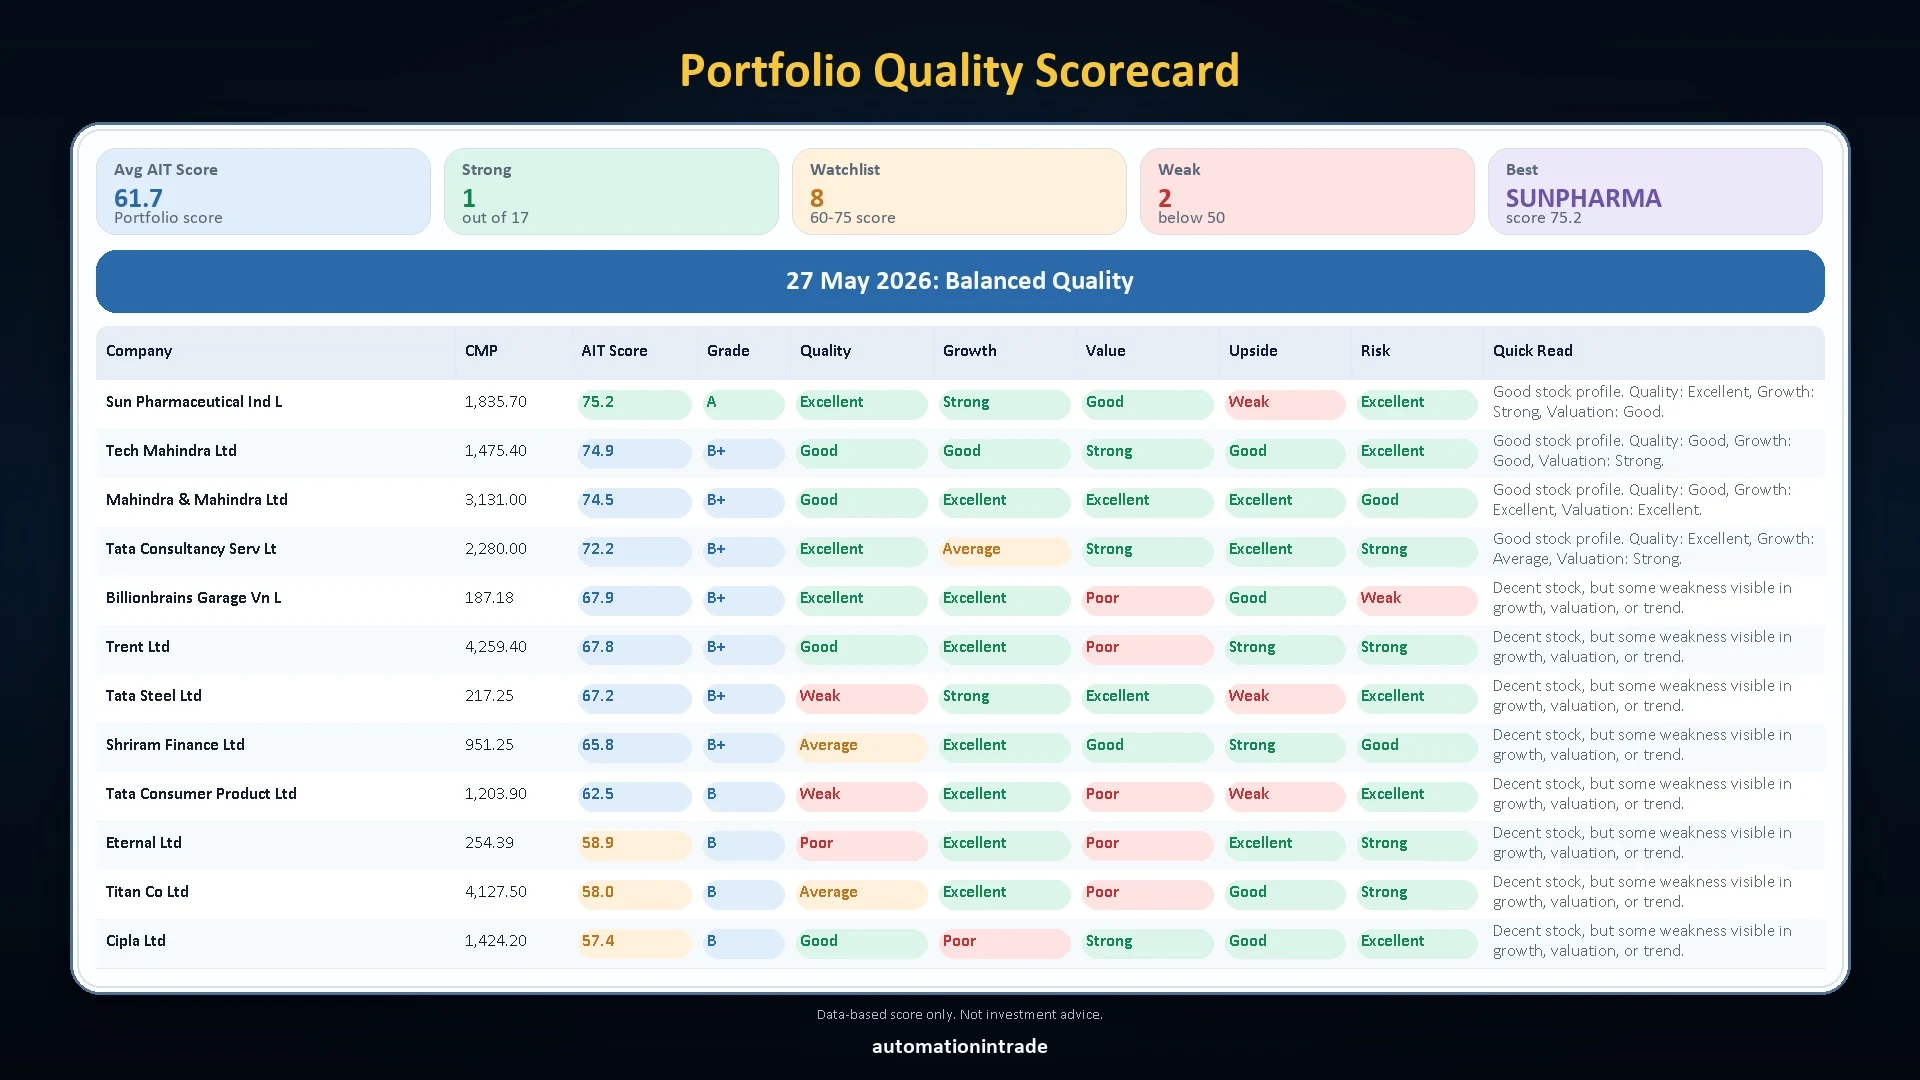
Enter holdings, generate scorecard, and find action areas in one view.
This sample summary shows how the tool turns a portfolio into clear action-oriented output. The banner row explains the simple process, and the cards below show the actual score snapshot users get.
Enter holdings
Generate scorecard
Find action areas
Score
What it does
Shows portfolio quality, not just portfolio value.
Broker apps mostly show holdings, profit/loss and current value. This tool adds a quality layer by scoring each stock using multiple labels and summarizing how many holdings are strong, monitor or weak.
Quality scorecard
Ranks stocks by AIT Score and grade so you can quickly see the best and weakest holdings.
Growth and value view
Separates quality, growth, valuation, upside and risk instead of giving one confusing single label.
Portfolio summary
Displays average score, strong count, monitor count, weak count and best stock in a compact top panel.
Sample output preview
Portfolio scorecard images generated from the analyzer output.
The desktop format is useful for dashboard-style review. The social format is useful for sharing a compact portfolio quality snapshot with Automation In Trade branding.
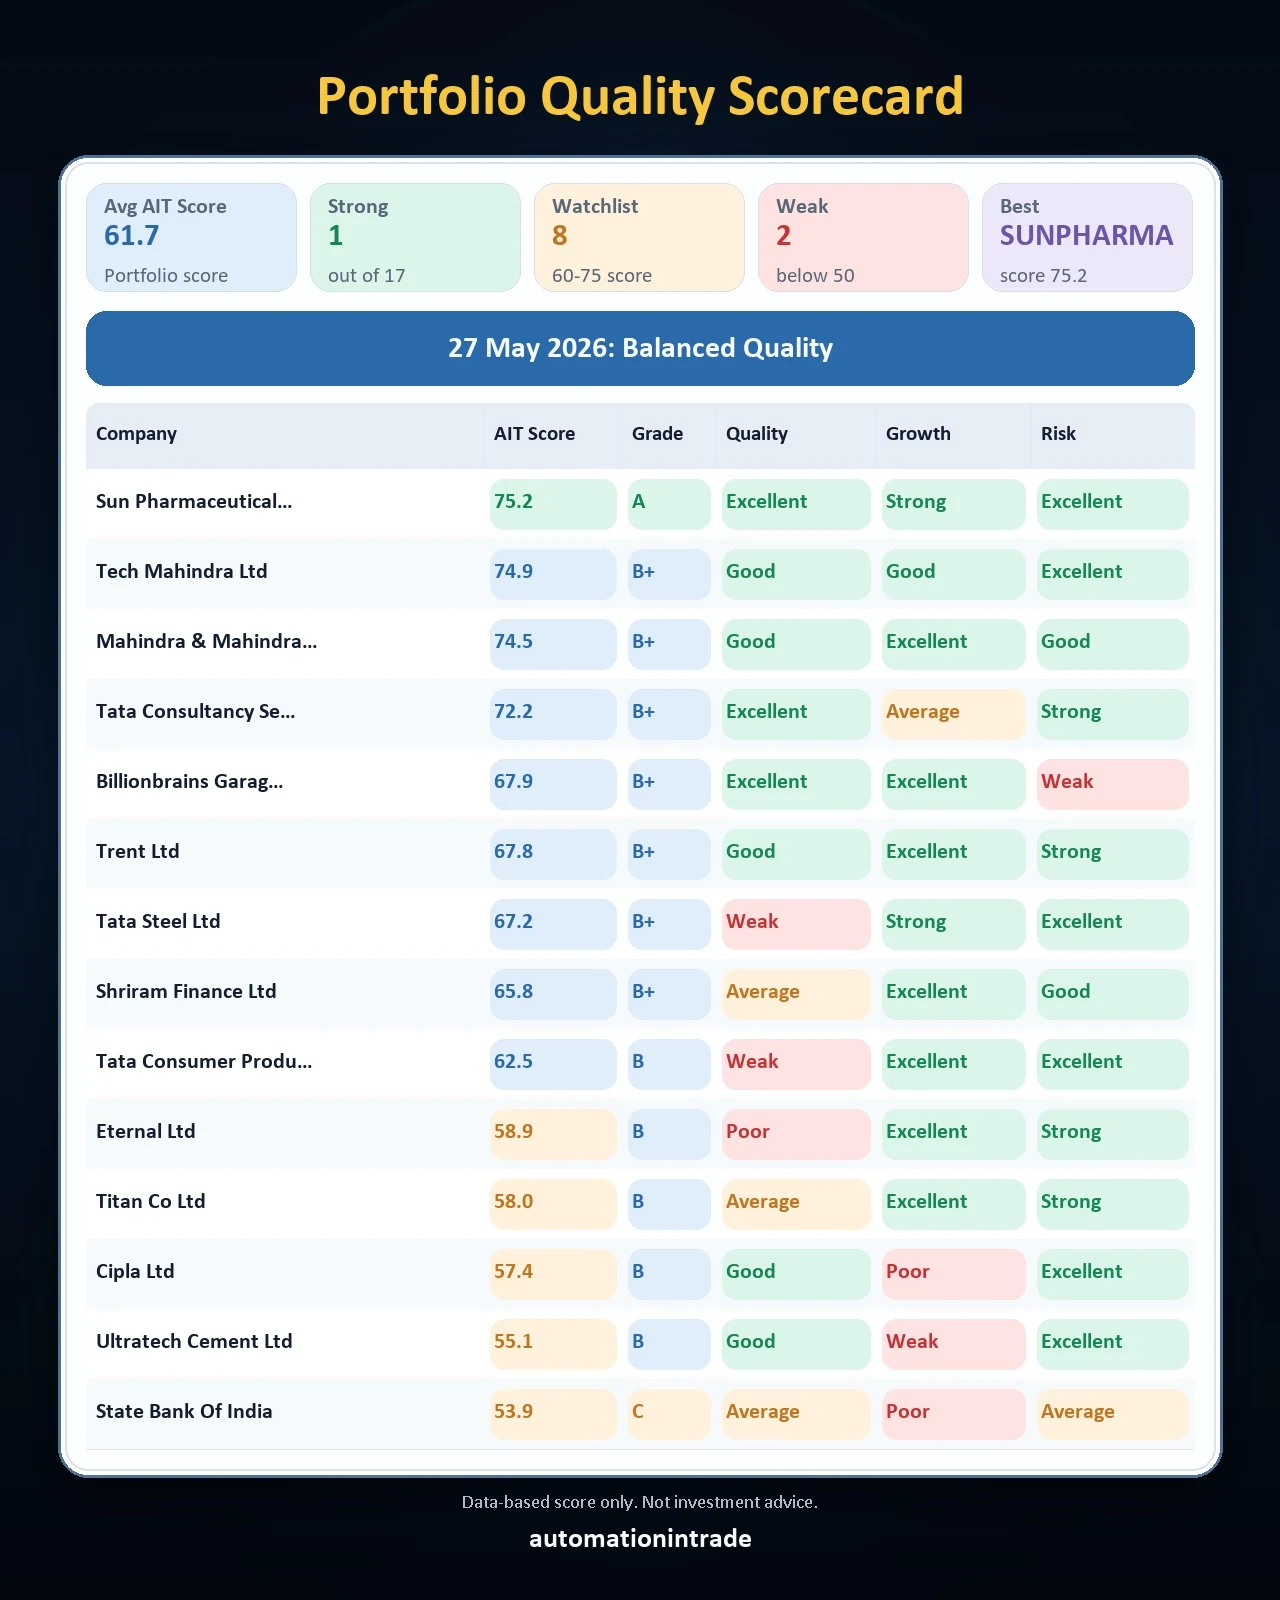
Social card: main scorecard
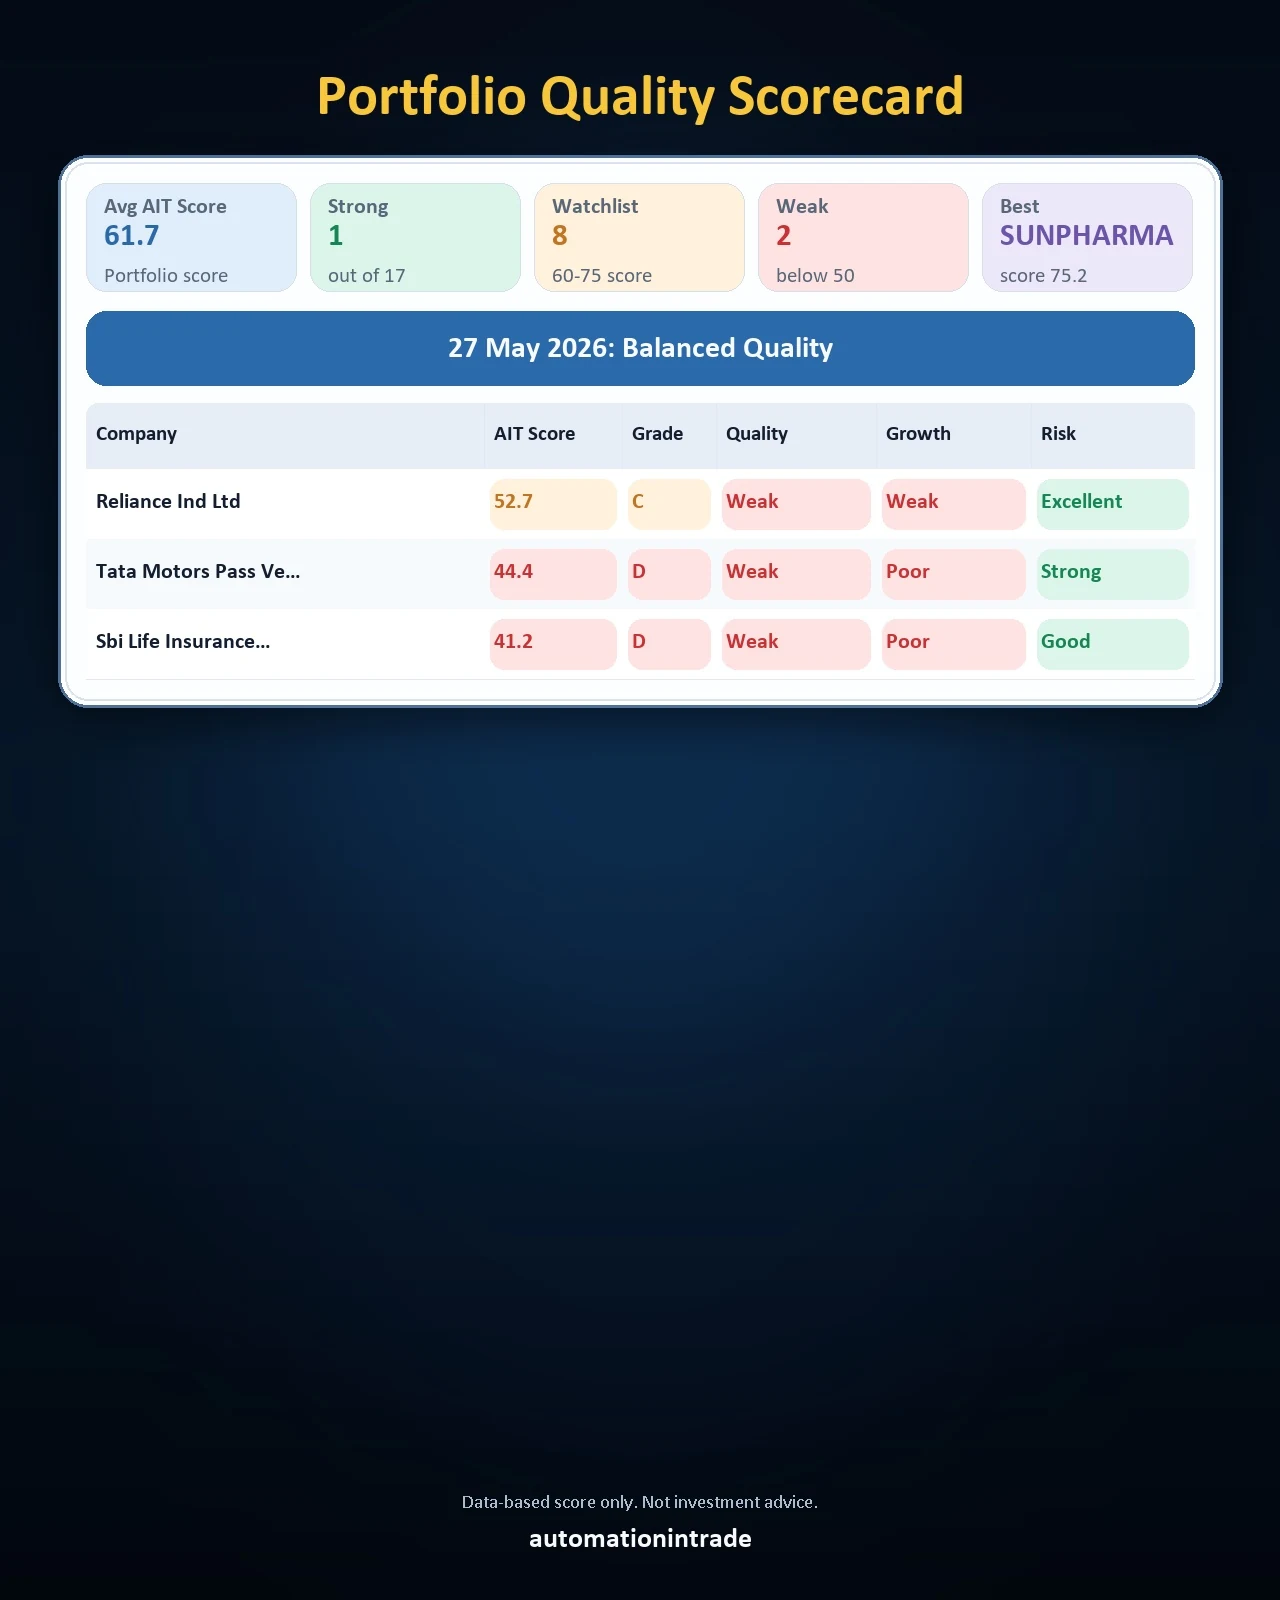
Social card: continuation view
Video demo
Watch the Portfolio Analyzer demo before using the tool.
The video is shown as a clickable preview only. It will not play automatically; playback starts only after the user clicks the video or opens it on YouTube.

Good Stocks, Monitor Stocks and Poor Stocks
See exactly which holdings are strong, which need monitoring, and which need attention.
These focused portfolio views make the scorecard easier to understand at a glance. Instead of reading the full sheet line by line, users can quickly separate stronger holdings from monitor names and weaker stocks.
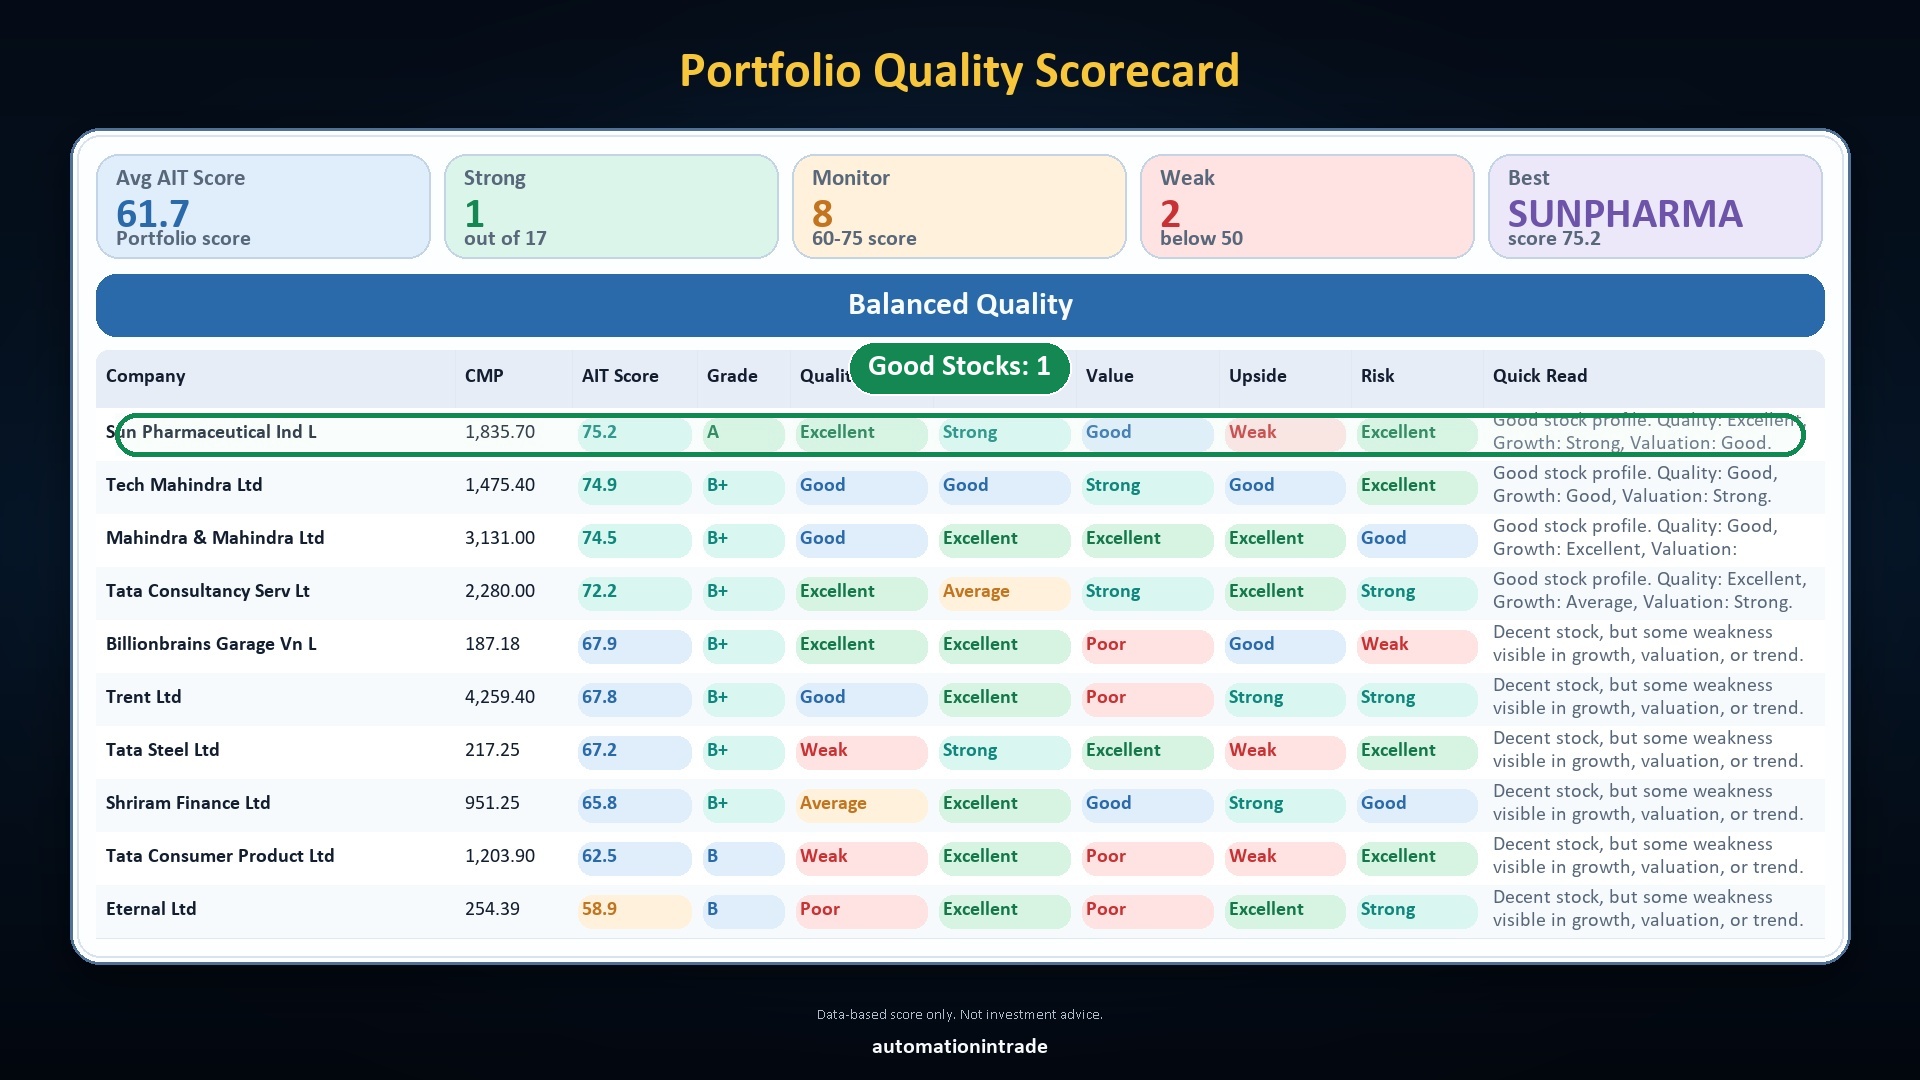
Good Stocks section
Highlights the strongest holdings in the portfolio so users can quickly see which names have better quality, stronger growth and healthier overall profile.
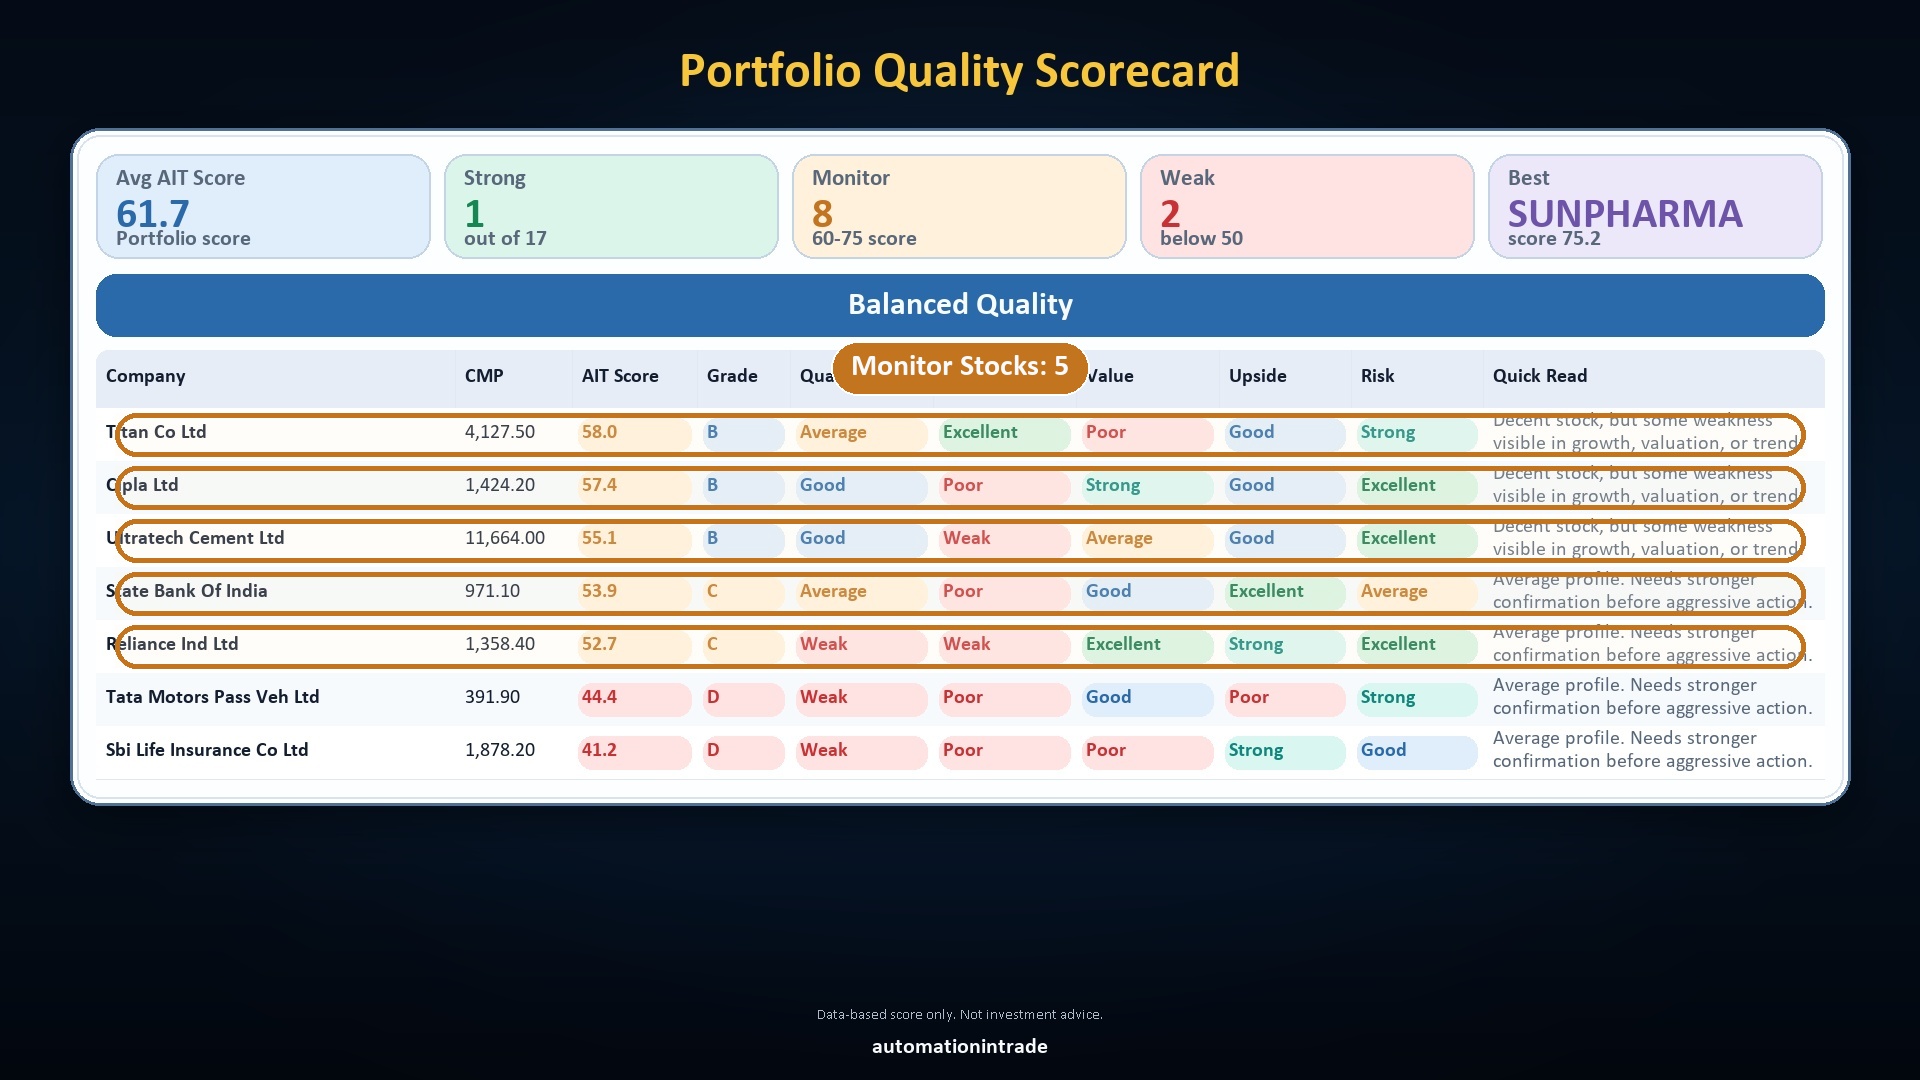
Monitor Stocks section
Separates stocks that are not weak yet but still need observation. This helps users track holdings that may improve or slip depending on future price action or fundamentals.
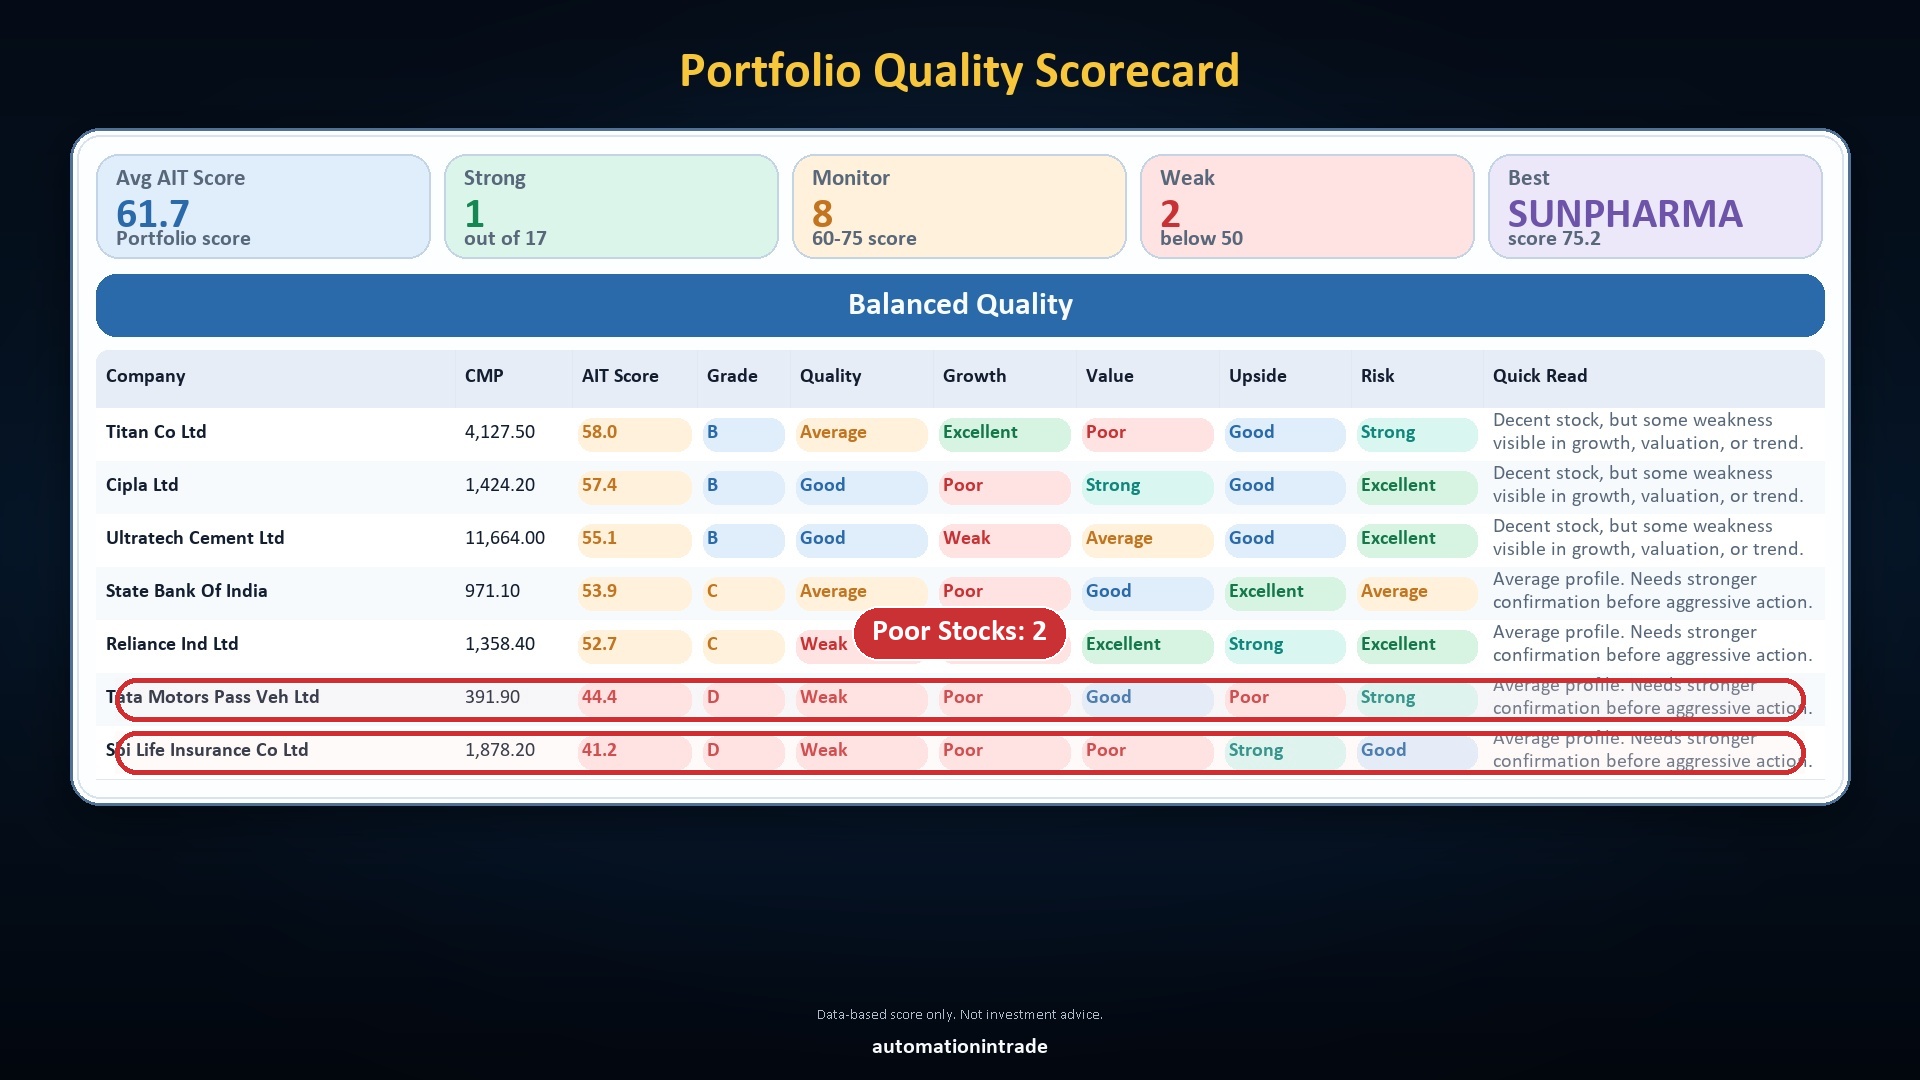
Poor Stocks section
Brings weaker holdings into focus so users can review whether those stocks deserve caution, closer monitoring, averaging only with care, or even an exit discussion.
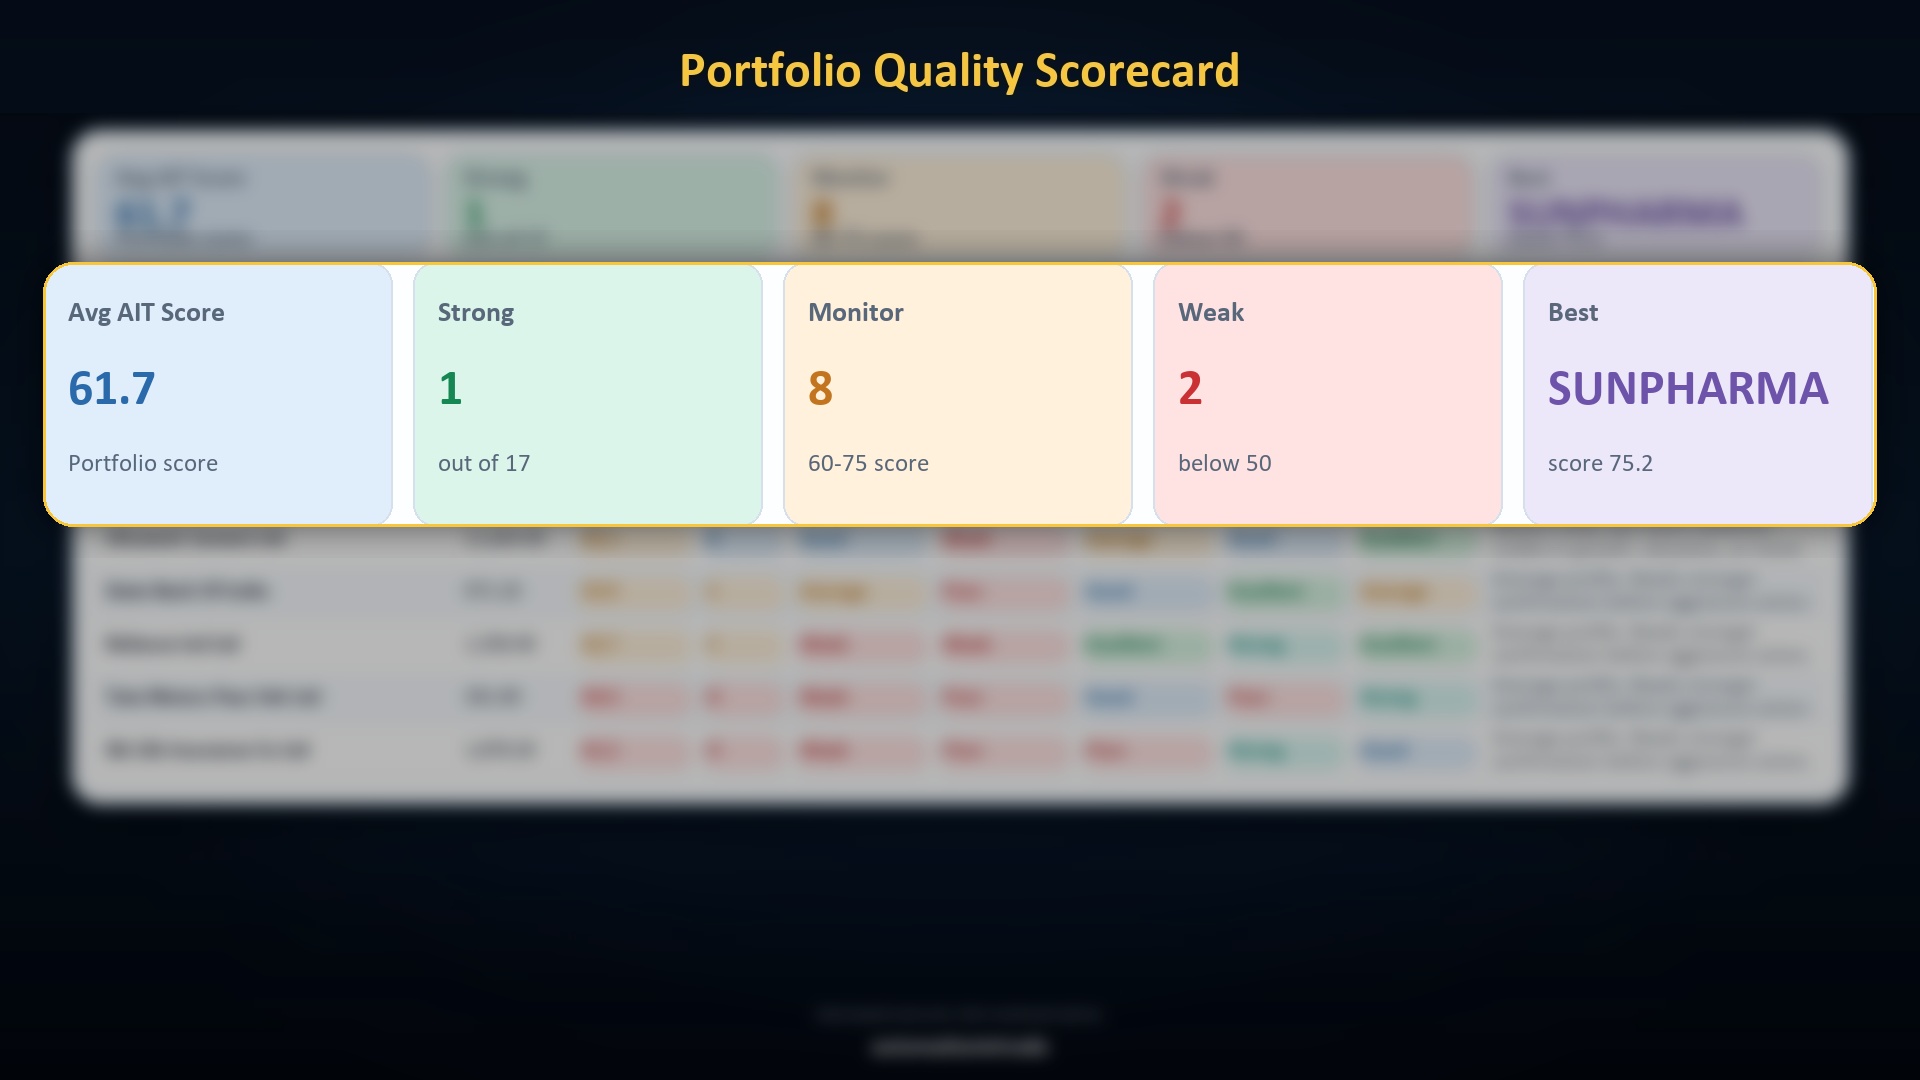
Why it is useful?
The top summary block gives a fast portfolio snapshot with average AIT Score, strong count, monitor count, weak count and best stock, making decision support much quicker than raw broker-style holding lists.
Why it is useful?
Six clear reasons to use Portfolio Analyzer.
Designed for quick, data-based portfolio review. It helps traders and investors understand portfolio quality faster, reduce guesswork, and identify where action may be needed.
- Instant portfolio quality view: quickly see which stocks are good, monitor-worthy, or weak.
- More data-based decisions: reduces emotion by showing score, quality, growth and risk clearly.
- Find weak stocks early: spot hidden weak holdings before they drag overall portfolio performance.
- Better capital allocation: helps decide where to keep, reduce or monitor larger allocations.
- One-click portfolio health check: view average score, strong stocks, monitor stocks, weak stocks and best holding in one report.
- Easier rebalancing decisions: use Good, Monitor and Poor buckets to decide add, hold, review or reduce actions faster.
Automation In Trade
Want to explore Portfolio Analyzer?
Use the form to request demo access, purchase details, or a custom portfolio analyzer workflow for your holdings and reporting format.