Buy Zone
Shows the estimated accumulation area near support using price action and volatility context.
Scan your watchlist or custom stock list in seconds. Get Excel summaries plus visual cards showing buy zone, stop loss, targets, support, resistance, trend, ADX, ATR and volume context.
How it works
The tool reads updated market data for every stock in your selected list, calculates price action levels, and converts the result into a clean visual card. Instead of manually checking charts one by one, you can instantly compare hundreds of stocks and focus only on the strongest actionable setups.
Shows the estimated accumulation area near support using price action and volatility context.
Provides a risk level based on support, ATR and trend structure, helping define downside clearly.
Generates target levels using risk-reward and current volatility, so the setup can be reviewed faster.
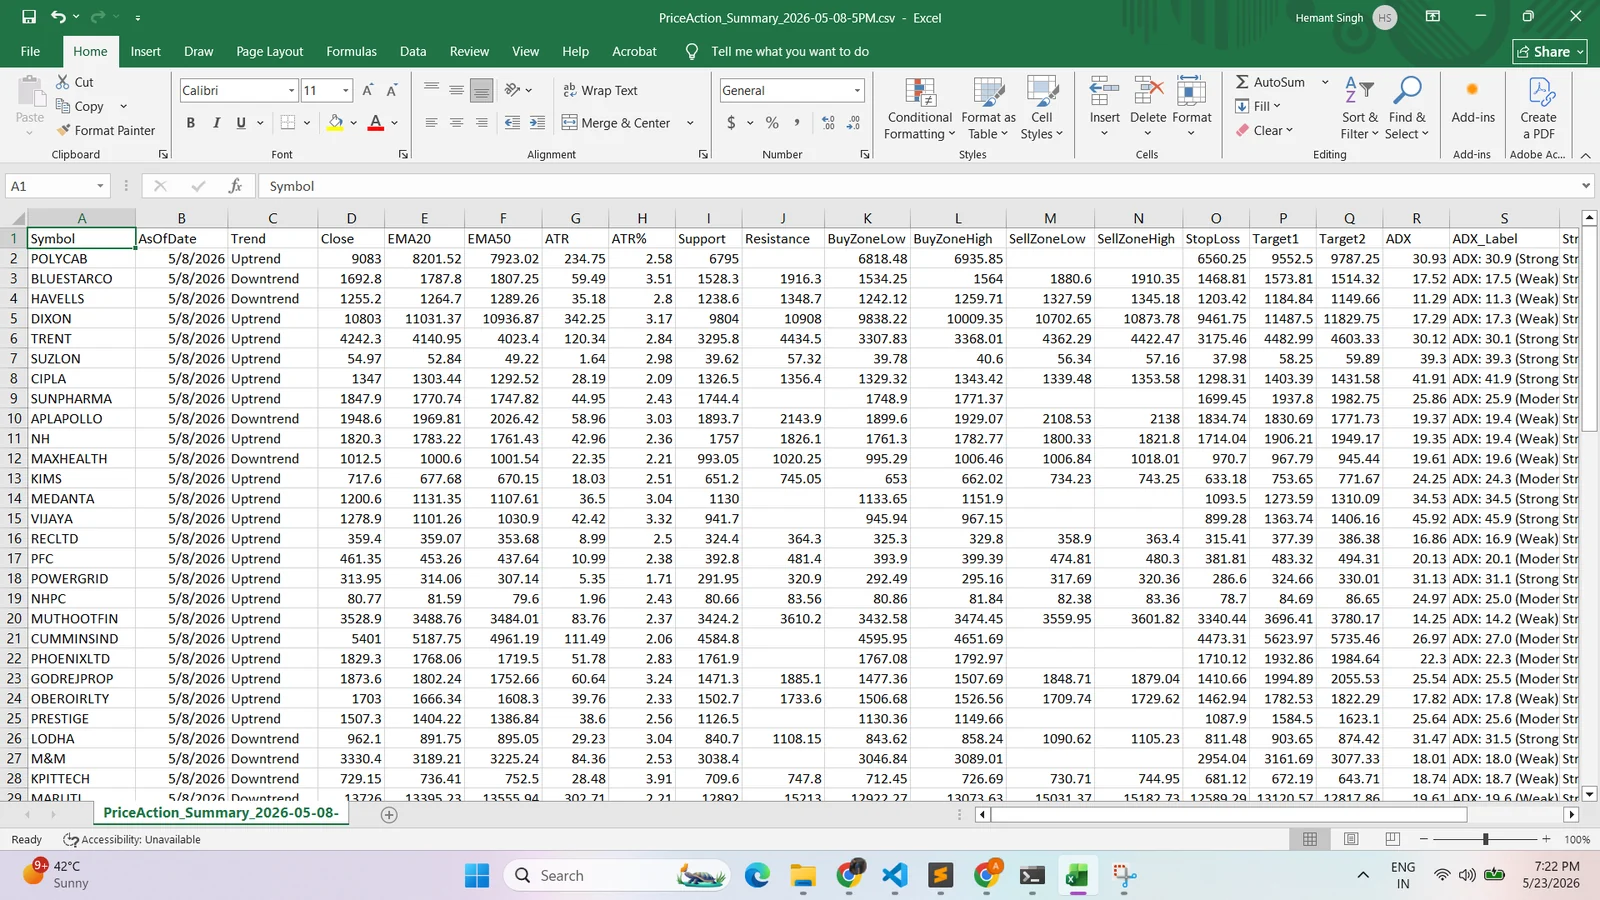
Excel workflow output
The Excel output works like a live trading dashboard. Instead of checking every stock separately, you can scan one table and instantly compare trend, close price, EMA20, EMA50, ATR, ATR%, support, resistance, buy-zone low/high, sell-zone low/high, stop-loss, target levels and ADX strength.
This improves the trading journey because it reduces manual chart-checking, keeps every stock in the same format, and helps you shortlist only the cleanest setups. A trader can filter for uptrend stocks, strong ADX, nearby support, clear buy zones, or better risk-reward before opening the chart card.
Why traders should use it
During live market hours, traders lose time switching between charts. This tool scans the entire watchlist and shows where price is near support, where trend is weak, where volatility is stable or expanding, and where the buy/target/stop-loss structure is clear.
For swing traders, it helps shortlist stocks near actionable zones. For positional traders, it helps understand trend quality, structure alignment, support/resistance, ADX strength and risk-reward before taking a decision.
USPs
Scan your complete watchlist or custom list without manually opening every chart.
Use it repeatedly during market hours to refresh levels with updated price data.
Get the most important decision levels in one clean card instead of scattered chart notes.
ADX, structure alignment, volatility and volume confirmation help judge setup quality.
Quickly identify which stocks deserve attention and which can be ignored for now.
Generate branded visuals for YouTube, Instagram, website pages and daily market updates.
Sample output preview
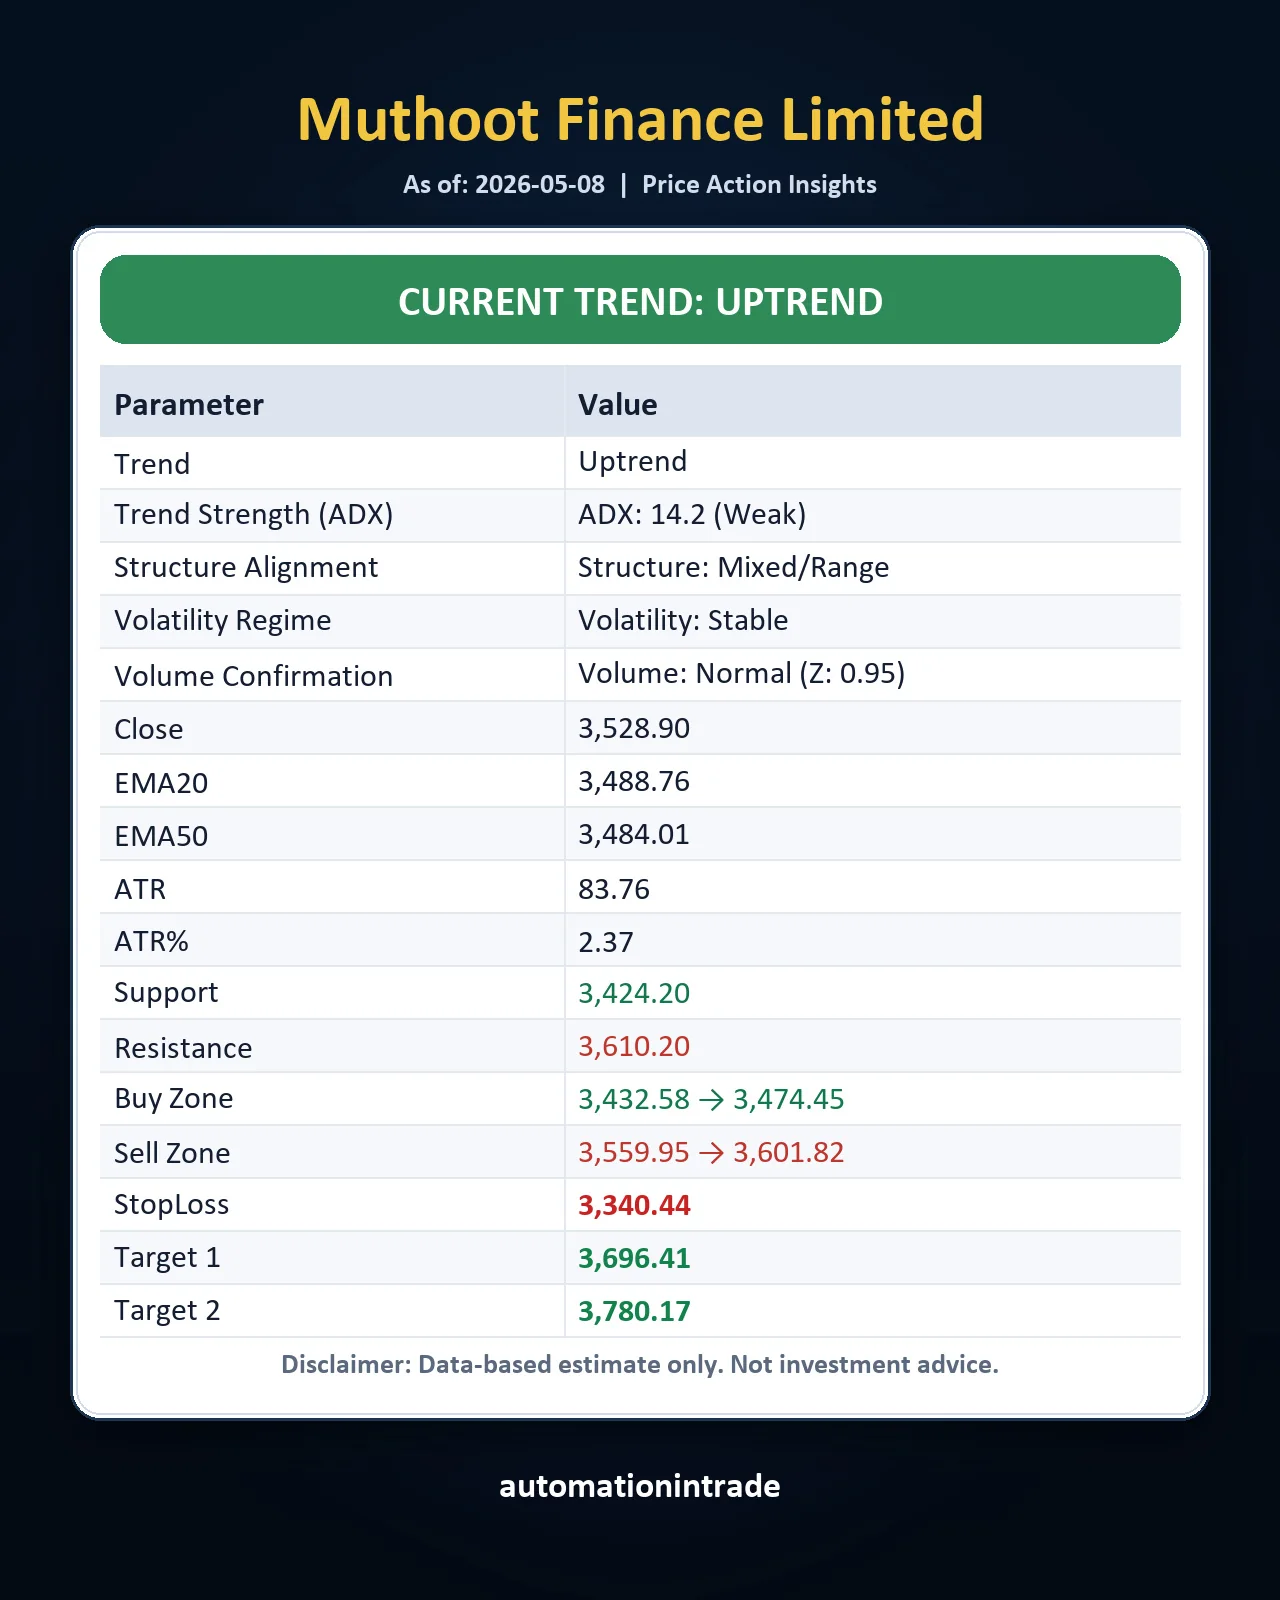
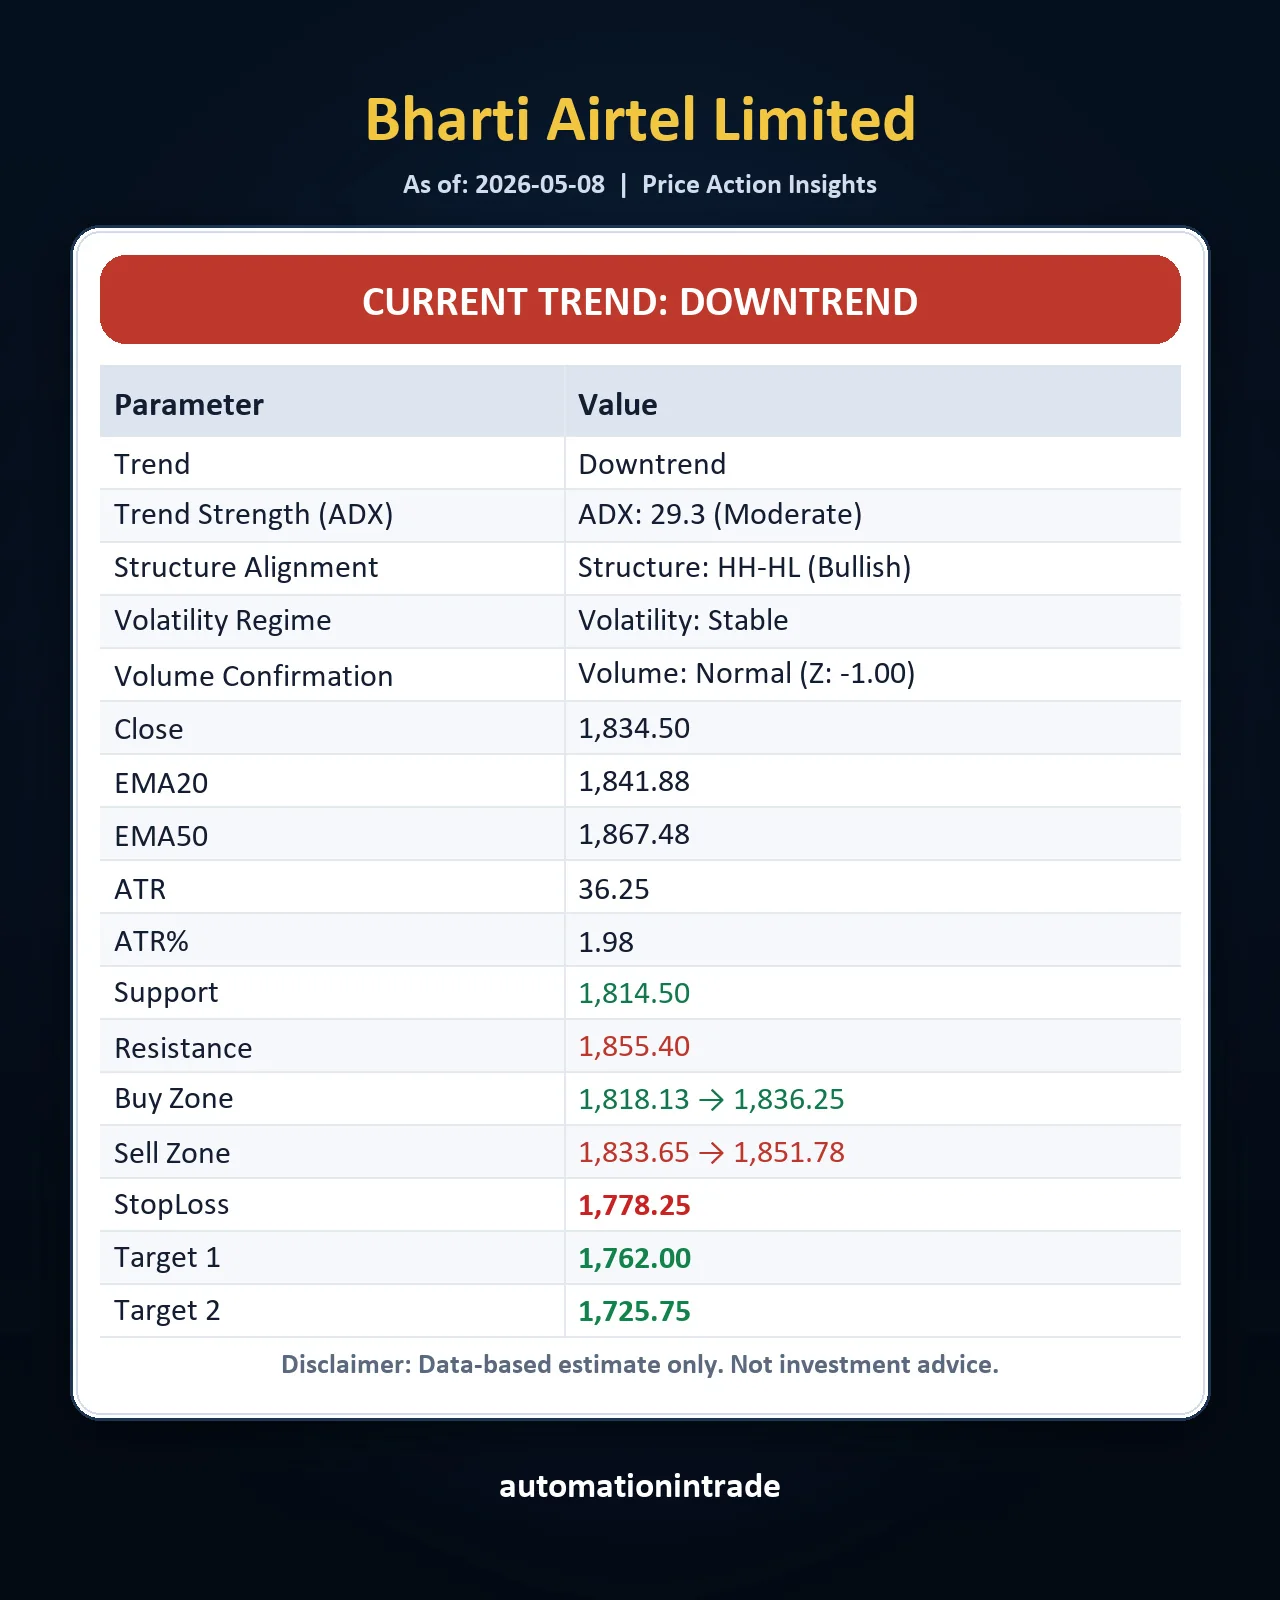
Each card summarizes trend, ADX, structure alignment, volatility, volume confirmation, support, resistance, buy zone, stop loss and targets.

Downtrend example with support, resistance, buy zone, stop loss and target levels.
Price action insight card with trend, ADX, volatility and zone levels.
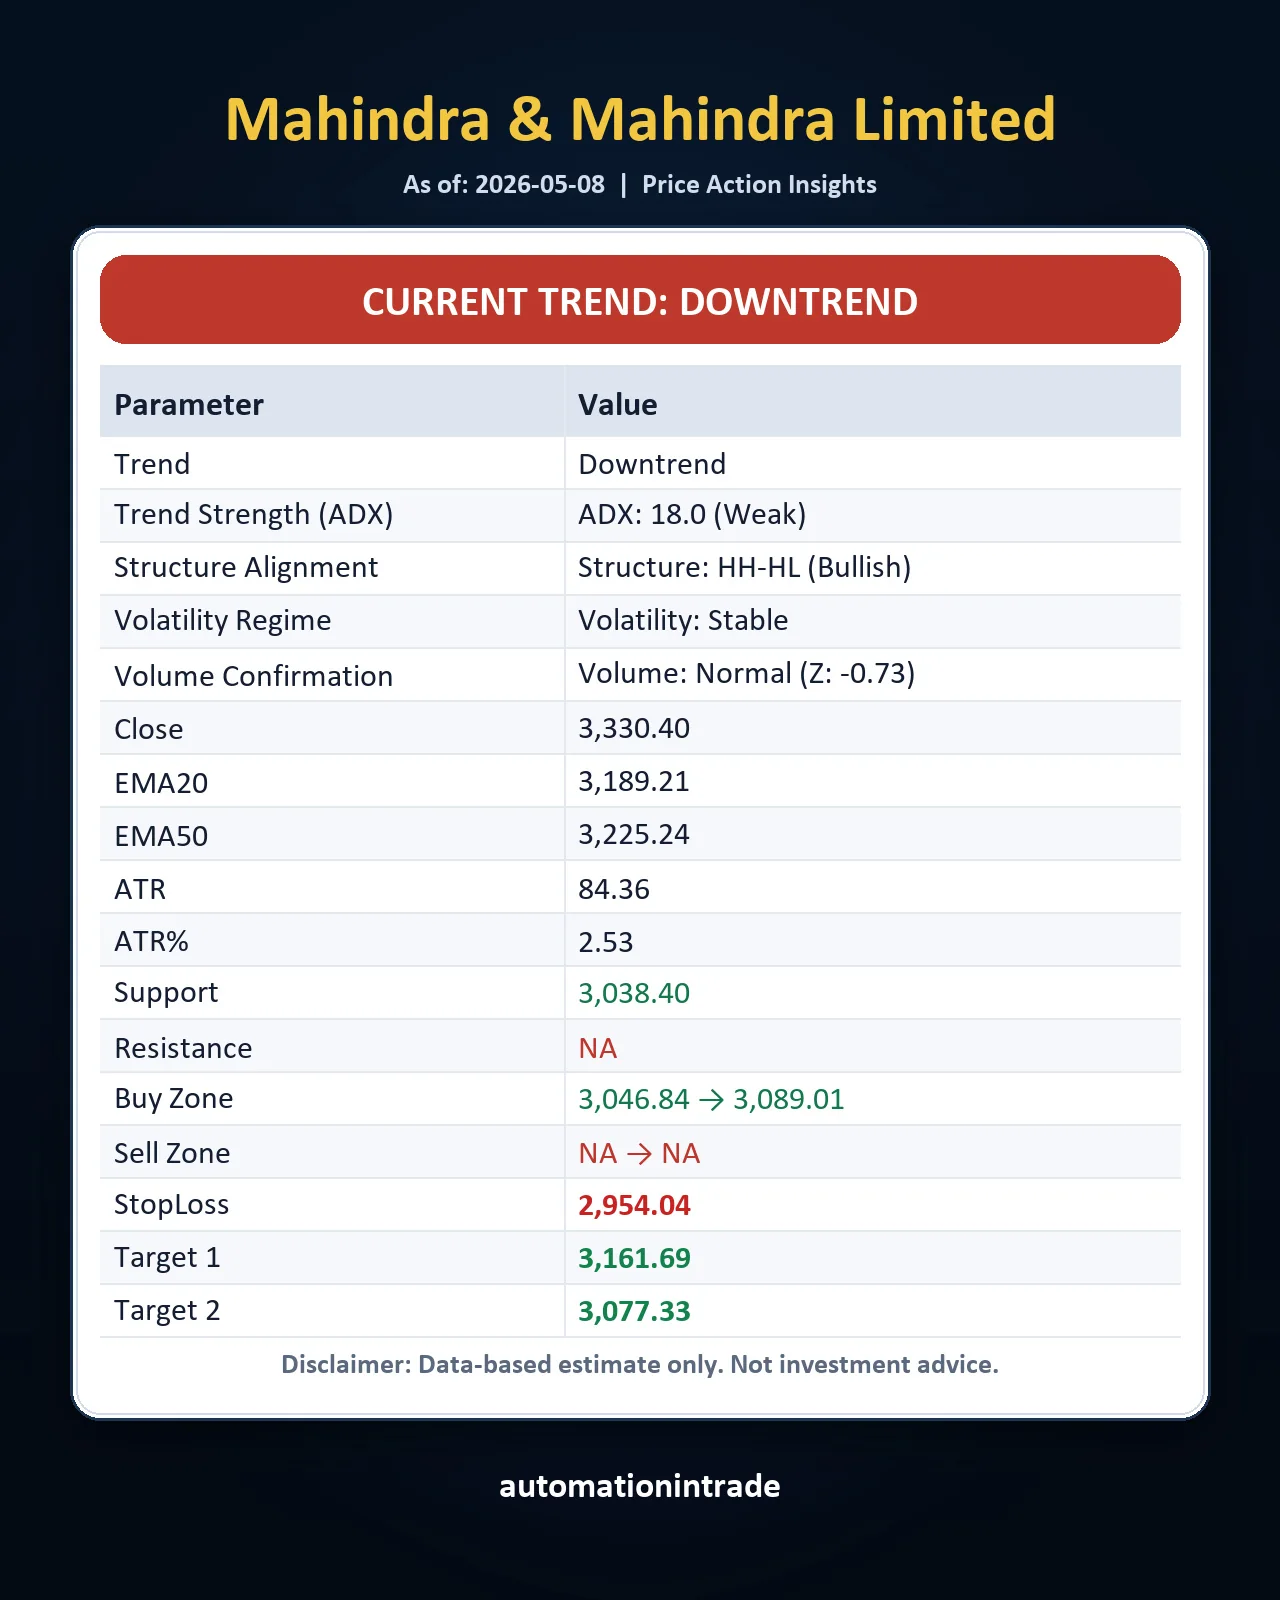
Shows how the system handles missing resistance and still provides buy zone, SL and targets.
Uptrend example with support, resistance, buy zone, stop loss and upside targets.
Automation In Trade
Request access for demo, purchase details, or custom setup based on your stock list and preferred output format.